
Day Hagan Catastrophic Stop Update April 28, 2026
A downloadable PDF copy of the Article:
The Day Hagan Catastrophic Stop model increased to 86.36%, up from 81.82% last week. The improvement was driven by an intermediate-term trend/momentum factor reversing from negative to neutral.
This follows the Stock/Bond factor turning positive two weeks ago, the narrowing in High-Yield option-adjusted spreads discussed three weeks ago, and the improvement in both equity and High-Yield bond breadth (even with Friday’s weak participation at new all-time highs—more below). The model continues to indicate that investors should maintain benchmark equity exposure.
Figure 1: The model improved as more trend-related factors joined the party. However, it is important to note that many of the indicators remain poised to revert to neutral, or sell, if the market decisively reverses.
The chart below analyzes the S&P 500’s short-term trend momentum by comparing its 21-day and 63-day moving averages. The current reading is about -0.04%, meaning the short-term average is nearly equal to, but slightly below, the medium-term average. That suggests momentum is roughly neutral, not strongly bullish or bearish. The indicator is far from the deeper negative levels that have historically marked sharp selloffs or more attractive oversold conditions.
Figure 2: Market momentum is neutral, but no longer washed out.
High-yield bond breadth is a measure of credit-market risk appetite: stronger readings indicate investors are more willing to own lower-quality bonds, while weaker readings suggest stress or risk aversion. The current reading is +6.66, which is above the 0% signal threshold and well above the -10% warning threshold. That means credit breadth is currently supportive, not signaling stress. In plain terms, the chart suggests that the high-yield bond market is signaling a potentially healthier risk environment for stocks, rather than warning of a broad market deterioration.
Figure 3: High-yield bond breadth supportive of risk-on.
There has been a lot of discussion about Friday’s new all-time high in the S&P 500 coming alongside weak participation: 324 index members closed lower, and only 5.6% of stocks made new 52-week highs. That is unusually narrow. Across all 546 S&P 500 all-time-high days from 1998 through April 2026, an average of 63.8 stocks, or about 12.7% of index members, made new 52-week highs, while an average of 176.5 stocks, or about 35.1%, closed lower. By comparison, the April 24, 2026, all-time high saw only 28 new highs, less than half the historical norm, and 324 declining stocks, nearly double the norm. So yes, recent leadership has been unusually concentrated. But the more important question is not whether breadth was bad; it is what forward returns have typically looked like after similarly narrow all-time highs.
Figure 4: Friday’s weak participation worried some folks.
Since 1998, there have been 20 instances when the S&P 500 closed at an all-time high while more than 300 index members finished lower on the day. Excluding the most recent occurrence on April 24, 2026, which does not yet have complete forward-return windows, the historical results are surprisingly constructive. Rather than underperforming the broader set of all ATH days, these “narrow ATHs” have generally produced stronger forward returns. The first week has tended to be choppy, with slightly negative average performance and a roughly coin-flip hit rate, but the 1- to 3-month results have been notably better. Three months later, the S&P 500 averaged about +3.1%, with an 80% positive hit rate. The main exceptions were November 2021, ahead of the 2022 bear market, and December 2024, ahead of the early-2025 drawdown. Most other cases saw the index continue higher despite weak day-of breadth. In other words, this condition highlights narrow leadership, but it does not, by itself, strengthen the bearish case.
Figure 5: Weak participation is not necessarily a bearish portent.
On April 10th, we highlighted what looked like a breadth thrust in high-yield bond breadth. Since 2005, there have been only 11 instances, including April 10, 2026, when the 10-day simple moving average of high-yield bond breadth surged from deeply bearish to bullish within 10 trading days. In the prior 10 completed cases, forward S&P 500 returns were generally strong across time horizons, with the best hit rate occurring one month later. The largest gains tended to appear near market bottoms, while the notable failures, in 2008 and 2022, occurred during structural bear markets. Overall, the signal has been bullish, but not flawless. So far, that has been the right read this time as well.
Figure 6: The spike in bond breadth has historically been a tailwind for equities, on average. It remains part of our “weight of the evidence” appraisal.
This chart compares the S&P 500 with the Day Hagan Daily Market Sentiment Composite. The current composite reading is 84.11, well above the +70 upper bracket, indicating elevated or optimistic sentiment. Historically, readings above this level often suggest a strong risk appetite and a positive market tone, but they can also indicate the market is becoming stretched in the short term. This is not necessarily bearish by itself; rather, it suggests investors are already leaning bullish, so near-term upside may be more vulnerable to consolidation, volatility, or disappointment.
Figure 7: The way we incorporate these types of models into our outlook is to "Go with the flow until it reaches an extreme and reverses." We're still going with the flow, but headwinds are building.
This chart shows market breadth using the Russell 3000, which gives a broader view of participation than the S&P 500 alone. As of late April 2026, 66.7% of Russell 3000 stocks are above their 50-day moving average, while 58.8% are above their 200-day moving average. That means breadth has improved meaningfully from recent lows and is broadly constructive.
Figure 8: The market’s advance is supported by a majority of stocks, based on widely-followed moving averages.
Moreover, both the S&P 500 Total Return Index and Nasdaq Composite have broken sharply higher and are trading above their 50-day and 200-day moving averages, confirming strong intermediate- and long-term uptrends. However, momentum is extremely stretched. The S&P 500’s 14-day RSI is 86.9, and the Nasdaq’s is 88.4, while their 5-day smoothed RSIs are above 90. That is tactically overbought, suggesting the trend is bullish but vulnerable to near-term consolidation, volatility, or a pullback.
Figure 9: SPX RSI extended near-term.
Figure 10: NASDAQ RSI extended near-term.
The chart below shows the S&P 500's gamma exposure by option strike. The index is near 7,166, and the background indicates it is in a positive gamma regime. In positive gamma, dealer hedging typically dampens volatility because dealers tend to buy dips and sell rallies. The largest nearby gamma concentrations appear around 7,160, especially at 7,200, suggesting those levels could act as magnets or areas of resistance/support. Overall, the chart points to a more stable options backdrop, with upside potentially drawn toward heavy-gamma strikes, but volatility likely muted unless price falls below the gamma-flip zone.
Figure 11: Gamma expected to flip to negative at SPX 6,973.90 as of this writing. “Gamma Flip” levels change moment by moment. Source: Barchart.com.
This chart shows the 5-year rolling z-score of equity exposure for a 10% volatility-targeting strategy. It measures whether vol-control strategies are holding unusually high or low equity exposure relative to their own recent history. The latest reading appears near -1, meaning exposure has fallen below normal, but is not at an extreme panic/de-risking level near -2.
Figure 12: Volatility-targeting funds have modestly rebuilt equity exposure recently, but they still appear underweight relative to their five-year history. That leaves some potential re-risking fuel if realized volatility continues to decline or stays contained. However, the signal is not deeply washed out, so while positioning could provide incremental support for equities, it does not suggest a major forced-buying setup.
This chart compares the S&P 500 with DBMF’s estimated exposure to the index. DBMF exposure recently moved sharply higher from a deeply negative position of around -45% to roughly +0.9%, meaning it has largely covered its equity short and is now near neutral. The takeaway is that managed-futures/trend-following exposure to U.S. equities has improved, but it is not yet meaningfully long.
Figure 13: If the S&P 500’s rally persists, these strategies may have room to add equity exposure, creating potential incremental buying support.
These charts show expected S&P 500 earnings growth by sector for 2026 and 2027, comparing current estimates with estimates from March 31. For 2026, expected index earnings growth has increased to 18.6% from 17.2%, led by very strong growth in Energy, Information Technology, and Materials. The biggest upward revisions appear in Energy and Technology. For 2027, expected growth is 16.1%, slightly lower than the prior estimate of 16.6%, with Technology still leading and Energy expected to decline.
Figure 14: 2026 SPX earnings estimates continue to increase at the index level.
Figure 15: 2027 SPX earnings estimates continue to increase at the index level.
This chart shows analysts’ bottom-up target prices versus current closing prices by S&P 500 sector. In aggregate, analysts see about 17.6% upside for the S&P 500. The largest implied upside is in Health Care at 23.0%, followed by Information Technology at 21.4% and Communication Services at 18.3%. The smallest upside is in Real Estate at 9.0% and Consumer Staples at 10.4%. Overall, analysts remain constructive, with every sector showing positive expected upside.
Figure 16: Analyst target prices show that every sector has a positive expected upside.
Once again, energy prices and vol were showing signs of peaking. Weekend news changed that dynamic. At this point, we continue to view an extended closure of the Strait as the largest risk to the uptrend.
Figure 17: As discussed last week, who knows when supply chains will return to normal? We’re not convinced this is over yet.
The Warsh process is still moving. The Senate Banking Committee is scheduled to vote Wednesday to advance Kevin Warsh’s Fed Chair nomination, after Sen. Thom Tillis dropped his hold following DOJ’s decision to end its Powell probe. Republicans control the committee 13–11 and the full Senate, so confirmation odds look high. Prediction markets agree: Kalshi recently put Warsh's confirmation before June at 96%, while Polymarket showed him at 99% confirmed. Powell’s chair term ends May 15, 2026; if Warsh is confirmed in time, he could start around then and potentially chair the June FOMC meeting. Powell may still decide whether to remain as a Fed governor. Warsh is not a clear “dove”: he has recently favored lower rates, but historically has had a more inflation-hawkish reputation and also wants a smaller Fed balance sheet.
Fed funds futures indicate the market expects the Fed to keep rates on hold, not cut them. CME FedWatch estimates probabilities from 30-day Fed Funds futures, and current pricing shows roughly a 99% probability of no change at this week’s meeting, with essentially 0% odds of a cut. For year-end, the market is mostly pricing no easing: recent FedWatch-based reports put the probability of rates remaining unchanged through 2026 around two-thirds.
Figure 18: We, like everyone else, see no action being taken on Wednesday, given the Warsh nomination process is still happening.
Current spread levels are in the lowest decile of their history, indicating a market environment with very little perceived credit risk. This suggests strong investor confidence and a risk-on backdrop in credit markets.
Figure 19: OAS not spiking.
1-year breakeven rate back down to 3.18% and the 2-year to 2.88%. Better, but still work to be done.
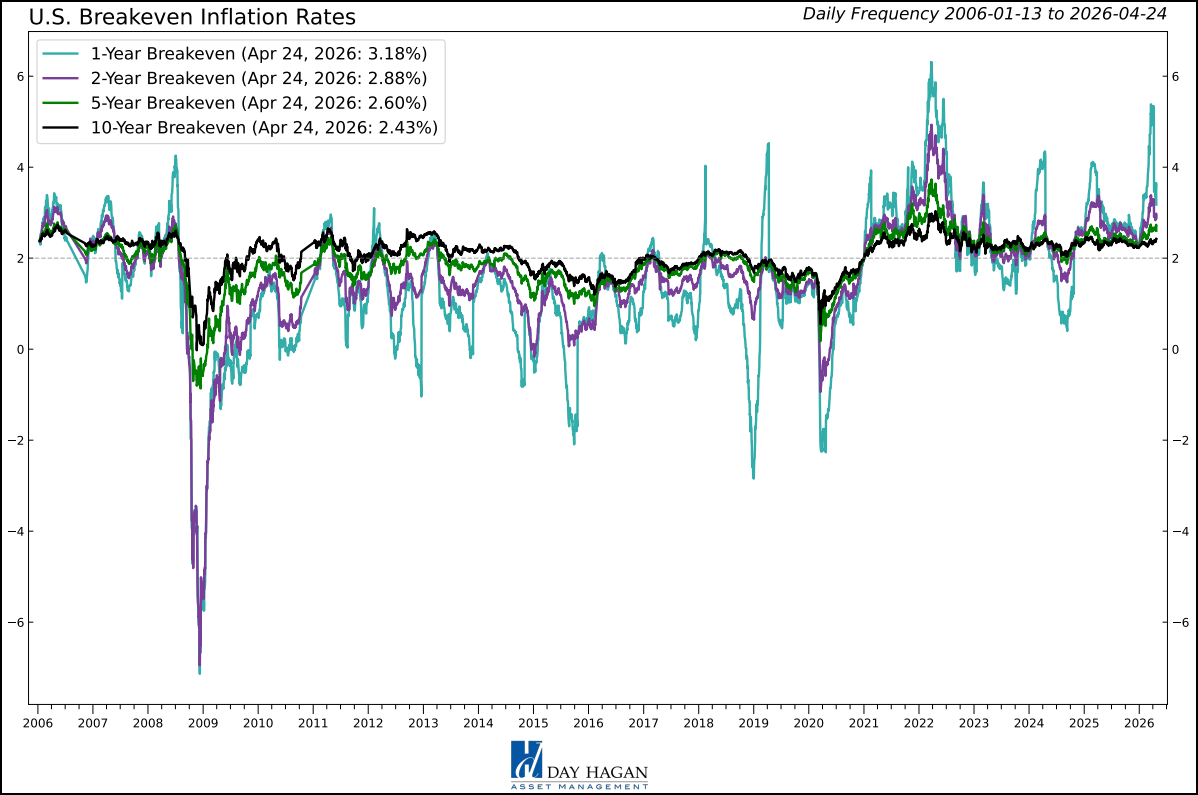
Figure 20: Longer-term breakeven rates indicate that inflation is “well anchored.”
Figure 21: All in all, “It’s like Deja vu all over again.” – Yogi.
U.S. Economic Releases:
Last week’s U.S. data were broadly firm. Retail sales and core retail sales beat forecasts, jobless claims stayed low, and PMIs improved, led by manufacturing. Housing was mixed, consumer sentiment improved, and inflation expectations eased slightly. Overall, growth looked resilient, not recessionary, with sticky demand.
FOMC on Wednesday.
PCE, ECI, Advance GDP, Unemployment Claims, Personal Income, and Personal Spending on Thursday.
PMIs on Friday.
Figure 22: Economic release calendar. Source: Forexfactory.com
Bottom Line: The weight of the evidence still favors equities, but the setup is no longer as clean. The Day Hagan Catastrophic Stop model improved to 86.36%, supported by better trend, credit, stock/bond, and breadth signals. High-yield breadth and tight credit spreads point to a risk-on backdrop, while broad market participation has improved. Even Friday’s narrow all-time high is not automatically bearish, as similar cases have historically produced constructive 1- to 3-month returns. Still, near-term risks are building: Sentiment is elevated, RSI readings for the S&P 500 and Nasdaq are stretched, and leadership remains concentrated. Positioning could add support if volatility stays contained and trend-followers rebuild equity exposure. Earnings estimates and analyst targets remain favorable, with every sector showing upside. The biggest risks are geopolitical, especially energy shocks, plus Fed uncertainty. Bottom line: The current trend remains constructive, but expect more volatility and less margin for error.
For more details on each sector and current model levels, please visit our research page at https://dayhagan.com/research.
This strategy uses measures of price, valuation, economic trends, liquidity, and market sentiment to make objective, rational, and emotion-free decisions about how much capital to place at risk and where to allocate it.
If you would like to discuss any of the above or our approach to investing in more detail, please don’t hesitate to schedule a call or webinar. Please call Tyler Hagan at 941-330-1702 to arrange a convenient time.
Sincerely,
Donald L. Hagan, CFA
Chief Investment Strategist, Partner, Co-Founder
Sources:
https://www.3fourteenresearch.com/
This material is for educational purposes only. Further distribution is prohibited without prior permission. Please see the information on Disclosures here: https://dhfunds.com/literature. Charts with models and return information use indices for performance testing to extend the model histories, and they should be considered hypothetical. All Rights Reserved. © Copyright 2026 Day Hagan Asset Management. Data sources: Day Hagan Asset Management, 3Fourteen Research, J.P. Morgan, Goldman Sachs, Barchart, StreetStats, Atlanta Fed, St. Louis Fed, Koyfin, Yardeni, MarketEar, S&P Global, SPDR, FactSet.
Disclosures
The information contained herein is provided for informational purposes only and should not be construed as investment advice or a recommendation to buy or sell any security. The securities, instruments, or strategies described may not be suitable for all investors, and their value and income may fluctuate. Past performance is not indicative of future results, and there is no guarantee that any investment strategy will achieve its objectives, generate profits, or avoid losses. Investing involves risks, including loss of principal.
This material is intended to provide general market commentary and should not be relied upon as individualized investment advice. Investors should consult with their financial professional before making any investment decisions based on this information.
Bonds are subject to market and interest rate risk if sold prior to maturity. Bond values will decline as interest rates rise, and bonds are subject to availability and changes in price. Bond yields are subject to change. Corporate bonds are considered higher risk than government bonds but normally offer a higher yield and are subject to market, interest, and credit risk.
References to markets, asset classes, and sectors, are generally regarding the corresponding market index. Indexes are unmanaged statistical composites and cannot be invested in directly. Index performance is not indicative of the performance of any investment and does not reflect fees, expenses, or sales charges.
Data and analysis are provided “as is” without warranty of any kind, either express or implied. Day Hagan Asset Management, its affiliates, employees, or third-party data providers shall not be liable for any loss sustained by any person relying on this information. The materials may contain “forward-looking” information that is not purely historical in nature. Such information may include, among other things, projections, forecasts, estimates or market returns, and proposed or expected portfolio composition.
All opinions and views expressed are subject to change without notice and may differ from those of other investment professionals within Day Hagan Asset Management or Ashton Thomas Private Wealth, LLC.
Accounts managed by Day Hagan Asset Management or its affiliates may hold positions in the securities discussed and may trade such securities without notice.
Day Hagan Asset Management is a division of and doing business as (DBA) Ashton Thomas Private Wealth, LLC, an SEC-registered investment adviser. Registration with the SEC does not imply a certain level of skill or training.
There is no guarantee that any investment strategy will achieve its objectives, generate dividends, or avoid losses.
All hypothetical results are presented for illustrative purposes only. Back testing and other statistical analysis is provided in use simulated analysis and hypothetical circumstances to estimate how it may have performed prior to its actual existence. The results obtained from "back-testing" information should not be considered indicative of the actual results that might be obtained from an investment or participation in a financial instrument or transaction referencing the Index. The Firm provides no assurance or guarantee that the products/securities linked to the strategy will operate or would have operated in the past in a manner consistent with these materials. The hypothetical historical levels have inherent limitations. Alternative simulations, techniques, modeling or assumptions might produce significantly different results and prove to be more appropriate. Actual results will vary, perhaps materially, from the simulated returns presented.
S&P 500 Index—An unmanaged composite of 500 large-cap companies, this index is widely used by professional investors as a performance benchmark for large-cap stocks.
S&P 500 Total Return Index – An unmanaged composite of 500 large capitalization companies. Professional investors widely use this index as a performance benchmark for large-cap stocks. This index assumes reinvestment of dividends.
Sentiment – Market sentiment is the prevailing attitude of investors toward a company, a sector, or the financial market.
OBOS Indicators—The overbought/Oversold (OBOS) index relates the difference between today’s closing price and the period’s low closing price to the trade margin of the given period.
Purchasing Manager Indexes (PMIs) – survey-based economic indicators that provide timely insight into business conditions.
FOMC Meeting – The FOMC (Federal Open Market Committee) holds eight regularly scheduled meetings per year. At these meetings, the Committee reviews economic and financial conditions, determines the appropriate stance of monetary policy, and assesses the risks to its long-term goals of price stability and sustainable economic growth.
Consumer Price Index (CPI) – Measures the monthly change in prices paid by U.S. consumers. The Bureau of Labor Statistics (BLS) calculates the CPI as a weighted average of prices for a basket of goods and services representative of aggregate U.S. consumer spending.
OAS: OAS spreads are the extra yield a bond offers over Treasuries, after adjusting for embedded options, used to gauge credit risk and relative value.
Catastrophic Stop model — Proprietary model used to indicate suggested equity exposure levels.
CDS — Contract designed to transfer credit risk of a referenced borrower.
Success rate — Percentage of historical observations producing a positive stated outcome.
NFCI: The National Financial Conditions Index measures overall U.S. financial stress using rates, spreads, leverage, and sentiment; negative readings mean looser-than-average conditions.
NFCI Credit Sub-Index: The NFCI Credit Sub-Index tracks credit-market tightness via borrowing conditions and spreads; a rise above zero indicates tightening, though current levels remain non-stressful.
Recession Probability Model: The recession probability model estimates U.S. recession risk using payrolls, production, income, and sales; readings above 50% have historically aligned with recessions.
High-Yield Bond Breadth: High-Yield Bond Breadth measures how widely spread tightening or weakening occurs across junk bonds; broad improvement often signals a stronger risk appetite.
Russell 3000: The Russell 3000 Index measures the performance of approximately 3,000 largest U.S. public companies, representing about 98% of the investable U.S. equity market.
PPI: PPI, or the Producer Price Index, tracks average price changes producers receive for goods and services, offering an early signal of inflationary pressure.
DBMF: DBMF is an actively managed futures ETF that aims to mirror hedge fund trend-following strategies by using long and short futures positions across stocks, bonds, currencies, and commodities.
For more information, please contact us at:
Day Hagan Asset Management
1000 S. Tamiami Trail, Sarasota, FL 34236
Toll-Free: (800) 594-7930
Office Phone: (941) 330-1702
Websites: https://dayhagan.com or https://dhfunds.com
© 2026 Day Hagan Asset Management
