Day Hagan Tech Talk: Pogo Stick
A downloadable PDF copy of the Article:
Summary
Although there has been internal improvement since late 2022-early 2023 (Figure 1), equity market proxies (plus sectors and individual stocks) rarely go up in a straight line because “things” get overbought short-term. Like now. With the Bulls still in control, don’t be surprised if stocks pause/pull back from recent gains.
Friday the 13th
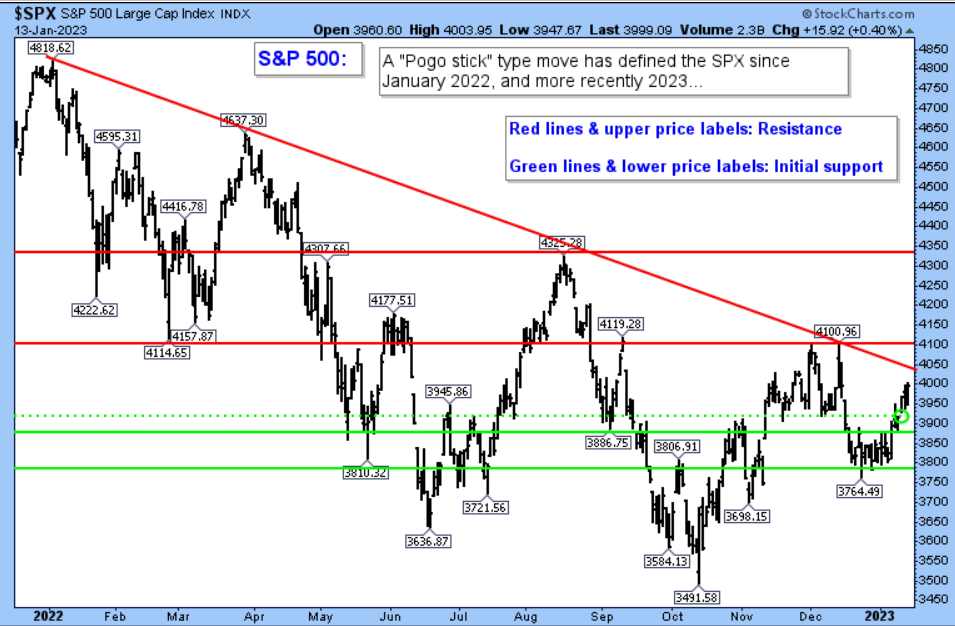
A pogo stick is a spring-powered device for jumping off the ground from a standing position, steered by shifting one’s weight off the centerline. We witnessed Wall Street’s own version of “shifting one’s weight” last week. This was made evident by many intraday changes of direction following the CPI report on Thursday and Friday the thirteenth’s “Big Banks” earnings reports, as well as many day-to-day price swings over the past four weeks.
Figure 1: S&P 500 Equal Weight vs. S&P 500 (capitalization weighted). | Internal improvement, as previously discussed in these reports, can be defined by a number of different measuring tools. In this case, the move in trend from lower left to upper right depicts breadth improvement—increasing upside participation with the Bulls still in control.
Figure 2: S&P 500. | A move by the S&P 500 above 4050-4100+/- resistance (I think the odds favor it ultimately happens) would have me look towards the August peak of 4300+/- as the next directional guidepost. Please refer to resistance and support levels highlighted inside the chart.
Figure 3: iShares Russell 2000 ETF – Small Cap proxy. | Approaching resistance (lower frame) and overbought readings (upper frame—please refer to comments inside the chart), but a solid close at 189 or above could accelerate the price trend higher and squeeze the Bears. Similarly, improving action by the Small versus Large relative trend is occurring. Please reach out for the chart.
At The Same Time
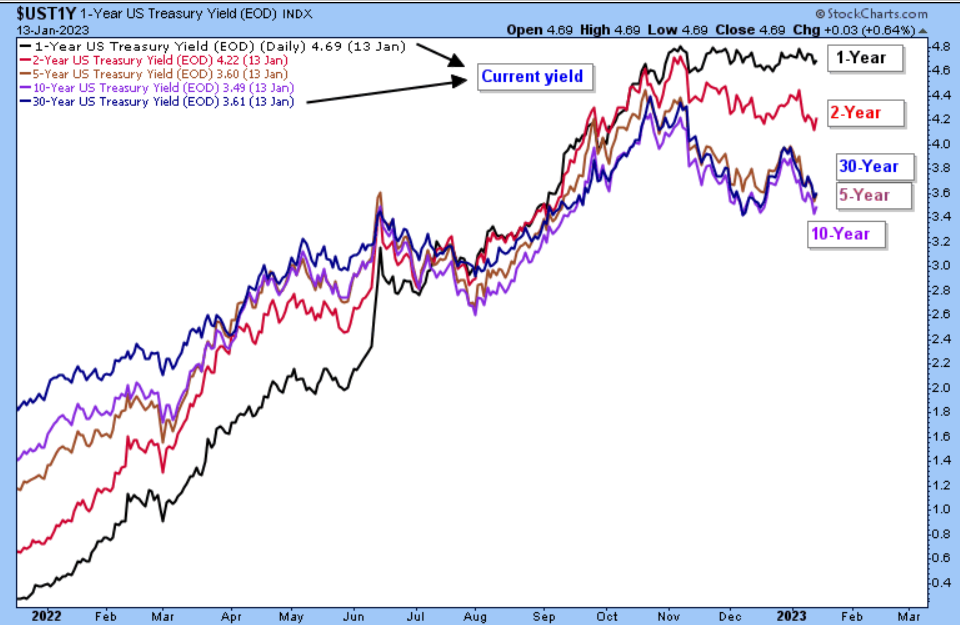
Following the fixed income rate market’s reaction to last week’s economic reports, which led to a further decline by interest rates, the 2-Year U.S. Treasury Yield (4.22%) is working its way beneath the Fed Funds rate (4.33%, target rate range 4.25%-4.50%, per NY Fed website). According to John Roque of 22V Research, “Similar action since the early 1980s has told us all when the Fed rate rising cycle was ending... Charts don’t lie.” To Mr. Roque’s observation I’ll add that if the bond market is the “all-knowing Great Oz,” then the 2-year U.S. Treasury Yield is saying the Fed is close to being done/should be done.
Figure 4: Select U.S. Treasury Yields (Doesn’t include all maturities due to spacing. Please reach out for charts of other maturities.) | 200-day MA support for the 10-Year U.S. Treasury Yield (3.49%), not shown below, is 3.28%. A move below support at 3.43-3.42% (previous reaction lows) opens up a test of the 200-day MA. I think the odds favor support breaking and believe this chart lends credence to Mr. Roque’s analysis.
Note: While the NDR Catastrophic Stop Loss Model has suggested a more fully invested position since mid-October/November 2022, a lot of questions still need to be answered as 2023 starts. The Day Hagan/Ned Davis Research strategies can provide a complement to core investment strategies relative to domestic equity, international equity, and fixed income exposure. Please reach out for specifics and how we can support you in 2023.
Day Hagan Asset Management appreciates being part of your business, either through our research efforts or investment strategies. Please let us know how we can further support you.
Art Huprich, CMT®
Chief Market Technician
Day Hagan Asset Management
—Written 01.16.2023. Chart and table source: Stockcharts.com unless otherwise noted.
Future Online Events
Disclosure: The data and analysis contained herein are provided “as is” and without warranty of any kind, either express or implied. Day Hagan Asset Management (DHAM), any of its affiliates or employees, or any third-party data provider, shall not have any liability for any loss sustained by anyone who has relied on the information contained in any Day Hagan Asset Management literature or marketing materials. All opinions expressed herein are subject to change without notice, and you should always obtain current information and perform due diligence before investing. DHAM accounts that DHAM or its affiliated companies manage, or their respective shareholders, directors, officers and/or employees, may have long or short positions in the securities discussed herein and may purchase or sell such securities without notice. The securities mentioned in this document may not be eligible for sale in some states or countries, nor be suitable for all types of investors; their value and income they produce may fluctuate and/or be adversely affected by exchange rates, interest rates or other factors.
Investment advisory services offered through Donald L. Hagan, LLC, a SEC registered investment advisory firm. Accounts held at Raymond James and Associates, Inc. (member NYSE, SIPC) and Charles Schwab & Co., Inc. (member FINRA, SIPC). Day Hagan Asset Management is a dba of Donald L. Hagan, LLC.


