
Day Hagan Tech Talk: Mercifully, 2022 Ends And 2023 Begins
A downloadable PDF copy of the Article:
Day Hagan Tech Talk: Mercifully, 2022 Ends And 2023 Begins (pdf)
Summary
Equity market volatility occurred in both directions in 2022. Given a plethora of well-known—and likely unknown—macro factors plus the influence computerized trading/CTA positioning have on near-term directional movements, I believe similar equity market volatility will continue in 2023. To start 2023, a multi-month trading range by the S&P 500 of between 3700/3550+/- and 4100/4300+/- would not surprise me. Let volatility in both directions work in your favor, not against you.
2022 In A Nutshell
Figure 1: 2022 Asset Class Performance – Commodities: GSCI Commodity Index, +8.71% (red); Currencies: U.S. Dollar, +8.03% (blue); Cash: SGOV, +1.58% (green); Domestic Equities: SPX, -19.44% (pink); Fixed Income: TLT, -31.23% (teal), 30-Year U.S. Treasury Bond -22.03%, not shown.
Please Note: 2022 performance figures for various parts of the commodity market (energy, livestock, agriculture, precious metals, industrial metals) purposely not included due to length of this report. Please reach out if you would like to see them.
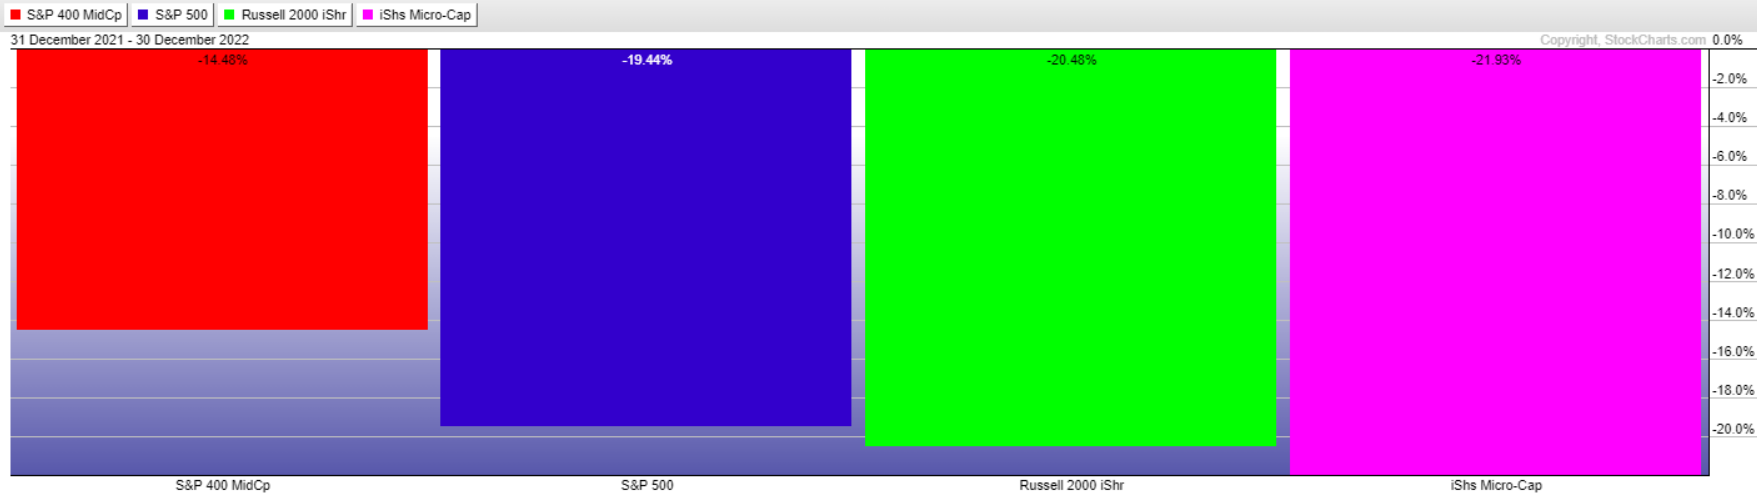
Figure 2: 2022 Capitalization Size Performance (domestic) – Mid-Cap: S&P 400 Mid-Cap, -14.48% (red); Large Cap: S&P 500, -19.44% (blue); Small Cap proxy: IWM, -20.48% (green); Microcap proxy: IWC, ‑21.93% (pink).
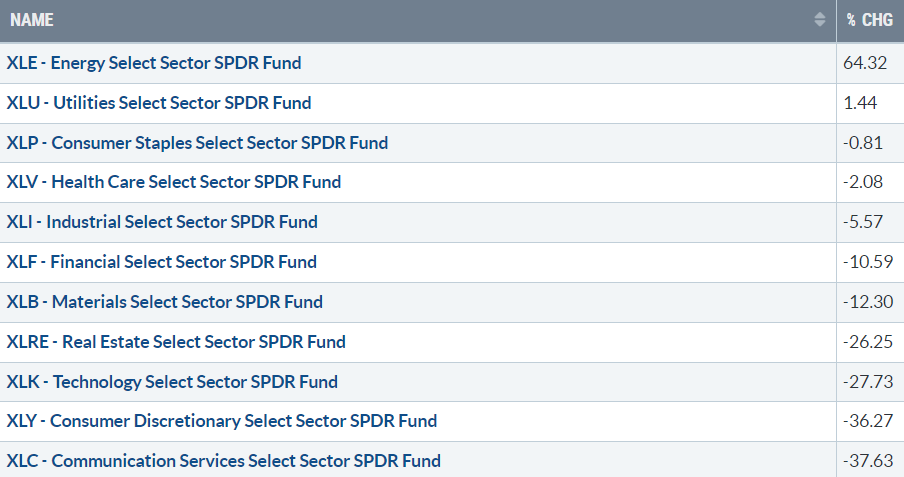
Figure 3: 2022 S&P Macro Sectors Performance – The January 2022 Smart Sector Strategy update showed that the NDR Sector Allocation Model overweighted Energy. The model ended 2022 in the same fashion.
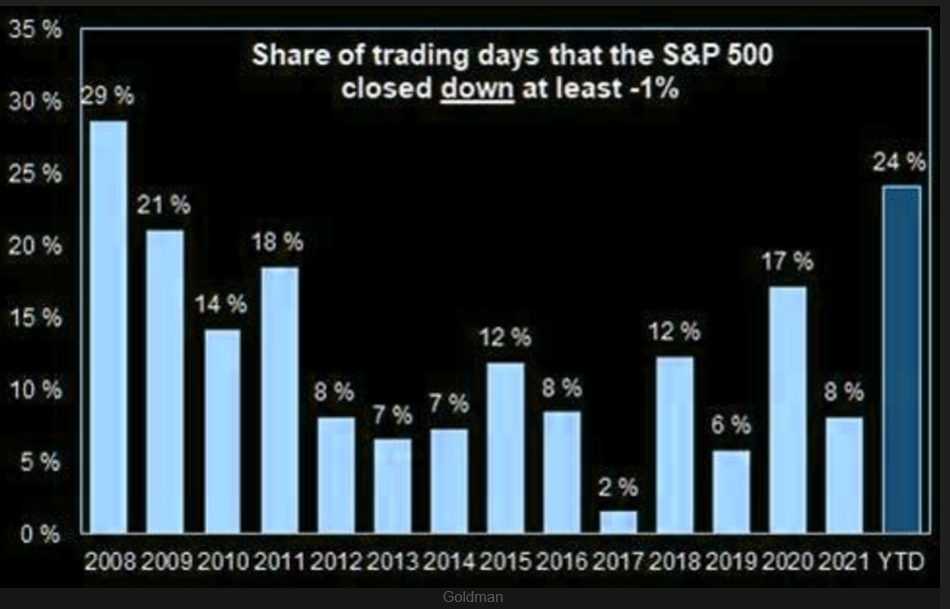
Figure 4: 2022 Volatility (source: Goldman) – This clearly affected investor and trader sentiment as 2022 wore on. It was also apparent in how Large Cap Growth/Technology/FANG stocks traded—see Figure 5.
Figure 5 is an example of the importance of recognizing the difference between a good company and a good stock. Many good companies were terrible stocks in 2022!

Figure 5: 2022 NYSE FANG+ Index Performance (components): No wonder Growth (especially Large Cap growth) underperformed Value, and domestic equal-weighted equity market proxies outperformed their cap/price-weighted indices.
2023: What We Know and Don’t Know
Considering a macro environment that remains precarious, to say the least, for investors, the two points below are the “tip of the iceberg,” simply a starting point for discussion.
What we know: Inflation highest in 40 years, QT/unfriendly global CBs, recession risk, earnings slowdown, Russia/Ukraine, & China.
What we don’t know: How much of the aforementioned issues have already been discounted by the equity and fixed income markets, along with questions about Big Cap Technology.
A lot of questions need to be answered as 2023 starts. Consequently, the Day Hagan/Ned Davis Research strategies may provide a complement to core investment strategies concerning domestic equity, international equity, and fixed income exposure. Please reach out for specifics and how we can support you in 2023.
Important Charts To Start 2023
I will do a more extensive review during my Chart Jamboree online event on 1/24/23, including global interest rates, Value leading Growth (no change from 2022), credit spreads (per Don Hagan, “Credit markets haven't seen nearly the amount of stress that typically accompanies bear markets in equities, suggesting that there is further to go or we're getting off easy”), crude oil (commodities?), and Small versus Large (while acknowledging the current historically strong period for Small Caps, I’d call this relationship neutral).
In the meantime, here are some important charts. According to Fidelity.com, Apple, Inc. (AAPL) represents 12.95% and 6.51% of the QQQ and SPY, respectively. Thus, the weekly relative strength chart of AAPL versus SPX with a declining 40-week MA in Figure 6 is concerning, as is Figure 7.
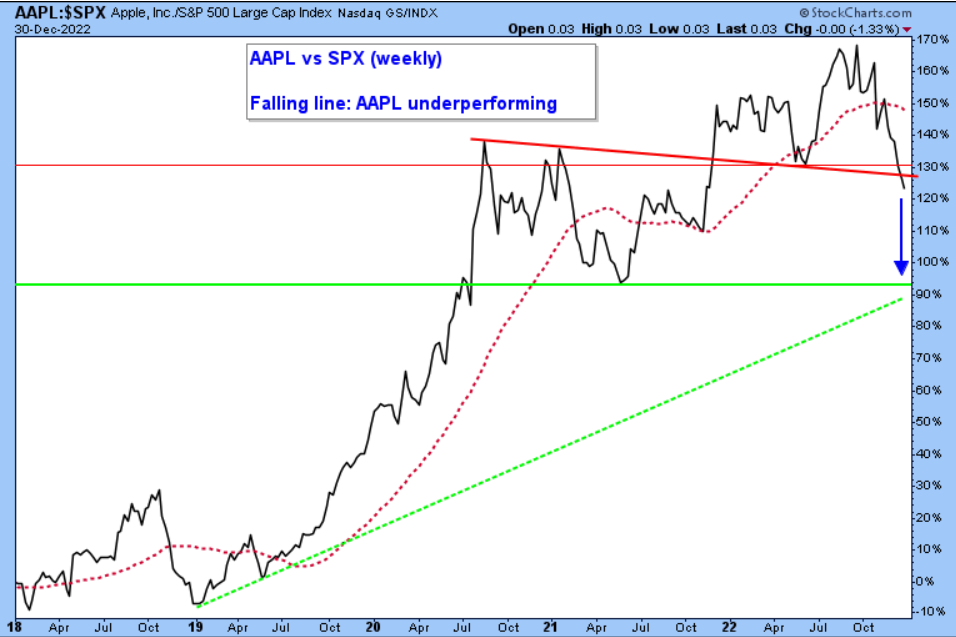
Figure 6: Weekly relative strength chart of AAPL versus SPX. Long-term price support: 200-week MA ~$112, not shown here. Please reach out for the price chart.
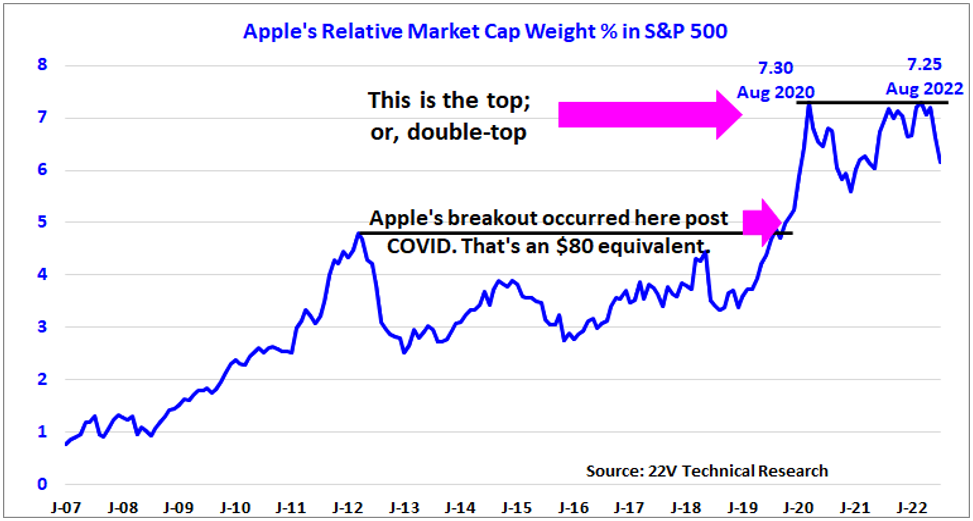
Figure 7: “At the end of the game, the king and the pawn go back in the same box." ~Italian proverb. Long-term price support: 200-week MA ~$112, not shown. Please reach out for the price chart.
The U.S. Dollar was one of the asset classes that was up in 2022. But the index recorded its gain between January and late September, after which it topped. It now sits at an important area of support.
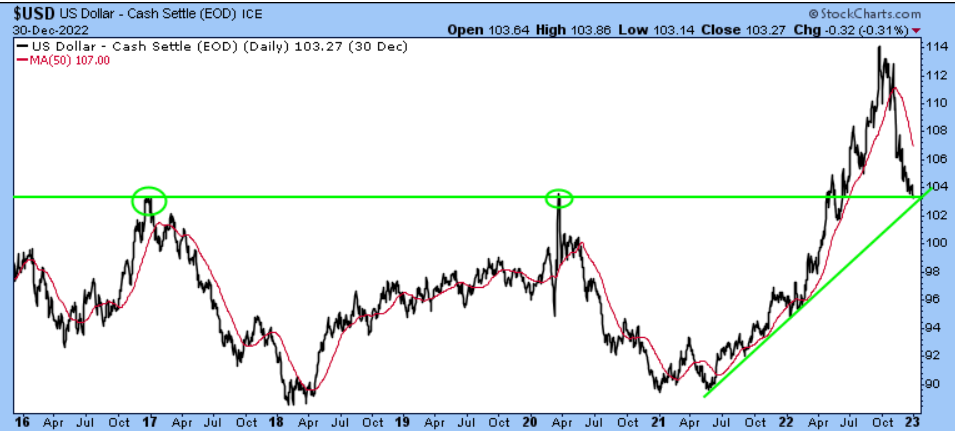
Figure 8: U.S. Dollar Index (daily with declining 50-day MA) – A breakdown below 103+/- wouldn’t surprise me, and would likely be received well (bullishly) by domestic equities.
The U.S. has outperformed the rest of the world for years, but the tide may be turning. Thus, the relationship depicted in Figure 9 may be a gamechanger in 2023, as the rotation from Growth to Value was in 2022. Please reach out for details about the Day Hagan/Ned Davis Research Smart Sector International Strategy.
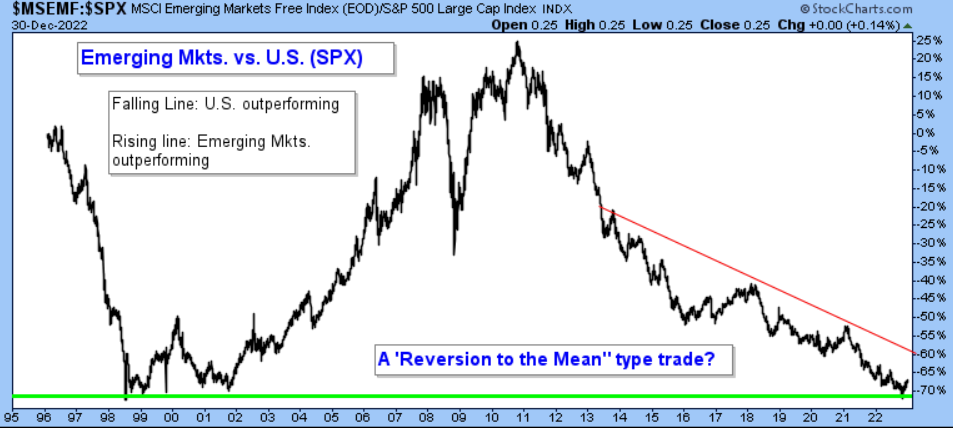
Figure 9: Emerging vs. U.S. (relative strength analysis): From a trend perspective, the U.S. is still leading. From a mean reversion perspective, an attractive risk-to-reward opportunity exists for the patient investor/disciplined trader who will manage risk (change opinion) if this ratio sets a new reaction low.
Considering the charts above and below, I am reminded of Walt Deemer’s wisdom: “To those forecasting an up [or down] year for equities in 2023, it’s not the endpoint that is important, but the path taken to get there.”

Figure 10: S&P 500 – Rangebound (neutral) from all perspectives. Play the range accordingly. If push comes to shove, the upside is given a try (money is put to work) as performance measures start anew.
Day Hagan Asset Management appreciates being part of your business, either through our research efforts or investment strategies. Please let us know how we can further support you.
Art Huprich, CMT®
Chief Market Technician
Day Hagan Asset Management
—Written 12.31.22 and 01.01.2023. Chart and table source: Stockcharts.com unless otherwise noted.
Future Online Events

Disclosure: The data and analysis contained herein are provided “as is” and without warranty of any kind, either express or implied. Day Hagan Asset Management (DHAM), any of its affiliates or employees, or any third-party data provider, shall not have any liability for any loss sustained by anyone who has relied on the information contained in any Day Hagan Asset Management literature or marketing materials. All opinions expressed herein are subject to change without notice, and you should always obtain current information and perform due diligence before investing. DHAM accounts that DHAM or its affiliated companies manage, or their respective shareholders, directors, officers and/or employees, may have long or short positions in the securities discussed herein and may purchase or sell such securities without notice. The securities mentioned in this document may not be eligible for sale in some states or countries, nor be suitable for all types of investors; their value and income they produce may fluctuate and/or be adversely affected by exchange rates, interest rates or other factors.
Investment advisory services offered through Donald L. Hagan, LLC, a SEC registered investment advisory firm. Accounts held at Raymond James and Associates, Inc. (member NYSE, SIPC) and Charles Schwab & Co., Inc. (member FINRA, SIPC). Day Hagan Asset Management is a dba of Donald L. Hagan, LLC.