
Day Hagan Smart Sector® with Catastrophic Stop Strategy Update October 2026
A downloadable PDF copy of the Article:
Day Hagan Smart Sector® with Catastrophic Stop Strategy Update October 2026 (pdf)
Executive Summary
The portfolio enters October overweight Information Technology and Financials, with a new modest overweight in Materials. Consumer Discretionary, Consumer Staples, and Health Care move from neutral to underweight. Communication Services remains underweight, and Industrials is underweight. Energy, Real Estate, and Utilities remain neutral. These changes direct more of our sector risk toward business investment and improving relative momentum, while reducing exposure where earnings revisions or market participation have weakened.
The economy is still growing, but that growth is becoming more expensive to finance. September’s flash S&P Global Composite PMI rose to 58.4 from 56.0 in August. The Federal Reserve nevertheless raised its policy range to 3.75%–4.00% on September 16. By month-end, the Treasury’s 10-year par yield was 5.29%, up from 4.75% at August’s close. Strong activity supports sales. Higher discount rates make investors less willing to pay for earnings that remain far in the future.
Earnings give us a reason to remain selective rather than broadly defensive. FactSet projects third-quarter S&P 500 earnings growth of 29.1%, up from 26.7% expected at June 30. All eleven sectors are expected to grow, but only four have received upward revisions to aggregate quarterly earnings during the quarter. Technology has the clearest combination of earnings strength and favorable model readings. Financials’ profit expectations have improved since June, although its market signals have weakened. Materials offers a smaller, more tentative opportunity because improving momentum has yet to be matched by better near-term earnings revisions.
Households are spending more while feeling worse. August real consumer spending rose 0.6%, but real disposable income was unchanged and the saving rate was 4.1%. September consumer confidence fell to 81.9. That is a reason to scrutinize the durability of demand, particularly when our Consumer Discretionary indicators are almost uniformly bearish. The underweight does not require a recession. It reflects a less attractive balance between expected returns and risk than we see elsewhere.
The portfolio also avoids equating a defensive label with an attractive investment. Staples and Health Care face downward earnings revisions despite their essential products and services. Energy’s indicators are strong, but its earnings remain sensitive to an oil price influenced by the Iran conflict. Our neutral weight retains exposure without increasing dependence on that outcome.
Sector
Consumer Discretionary
Consumer Staples
Communication Services
Energy
Financials
Health Care
Industrials
Information Technology
Materials
Real Estate
Utilities
Outlook (relative to benchmark weighting)
Underweight
Underweight
Underweight
Neutral
Overweight
Underweight
Underweight
Overweight
Modest Overweight
Neutral
Neutral
Figure 1: Weak participation and limited earnings growth support the reduction to underweight.
Consumer Staples - Underweight
We move Staples to underweight because the earnings evidence has weakened alongside the model. Essential demand helps stabilize revenue, but it does not automatically protect margins or produce attractive relative returns. Most indicators are bearish. Weak trend, breadth, food-sales, food-inflation, valuation, and short-interest readings outweigh favorable momentum and financial conditions.
FactSet expects third-quarter earnings growth of 2.9%, down from 6.4% at June 30. Aggregate expected earnings have been cut 3.3%, and 23 of 33 companies have received lower EPS estimates. Walmart was the largest contributor to the dollar decline. These are changes in expectations, not reported third-quarter results, but the breadth of the reductions argues against treating the problem as one company’s issue.
Valuation does not offer an obvious offset. The sector’s forward P/E was 21.0, compared with 20.8 over five years and 20.1 over ten years. Investors are paying a premium to the overall market for comparatively modest projected earnings growth. In an environment of expensive freight, packaging, and household essentials, companies need volume and productivity gains to defend profits. Repeated price increases can invite trading down.
The underweight reflects that unfavorable combination. We would become more constructive if unit demand stabilized, estimate cuts slowed, and improvement spread beyond a small number of large retailers. Defensive revenue remains useful, but we want stronger evidence that it will translate into shareholder returns.
Figure 2: Estimate cuts and weak breadth reduce the appeal of defensive demand
Communication Services - Underweight
Communication Services remains underweight despite a strong headline earnings forecast. Trend, deviation from trend, the yield-curve relationship, and relative earnings yield indicators are bearish. One overbought/oversold measure is bullish. The sector has not supplied enough market confirmation to warrant a larger allocation.
FactSet projects third-quarter earnings growth of 51.3%. Excluding Meta Platforms and EchoStar, the estimate falls to 11.9%. That concentration is different from last quarter’s Alphabet investment-gain effect and should be evaluated on its own terms. The businesses can be performing well while the sector headline overstates how broadly that strength is distributed.
Expectations are also demanding. About 70% of analyst ratings in Communication Services were Buys in the September 25 report. Such optimism is not inherently bearish, but it leaves less room for disappointing advertising revenue, subscriber economics, or returns on capital spending. Digital platforms must show that investment in computing capacity produces durable cash flow. Telecom and legacy media face different competitive and financing constraints.
An underweight preserves participation in the sector while directing more active exposure to Technology, where earnings revisions and the model are more closely aligned. We would look for broader profit contributions and improving relative trends before increasing Communication Services
Figure 3: Concentrated earnings growth has not overcome weak relative-market signals.
Energy - Neutral
Energy remains neutral even though most indicators are bullish. Trend, breadth, volatility, cash-flow yield, inventories, rig activity, and crude-price relationships are supportive. The dollar relationship is bearish. The model gives us a strong reason to maintain exposure, while the commodity and geopolitical risks argue for restraint in its size.
The earnings outlook has improved sharply. FactSet projects third-quarter growth of 111.4%, up from 79.3% at June 30. Aggregate estimates have risen 18.0%, led by refiners. Refining and marketing earnings are projected to rise 427%, while oilfield equipment and services earnings are expected to decline 9%. Even here, a strong sector result does not describe every business.
WTI futures settled at $90.42 on September 30 and gained about 5% during the month. Stalled U.S.–Iran talks and tight fuel markets supported prices, illustrating how quickly diplomacy and supply conditions can alter the outlook. Higher prices benefit some producers and refiners while raising costs elsewhere in the portfolio.
Neutral retains exposure to those cash flows and the potential benefit from further supply disruption. It avoids requiring another oil-price increase to justify a larger allocation. Our preference remains for financial discipline and attractive cash generation through a range of commodity prices. A durable improvement in supply could reduce the geopolitical premium even while reported profits remain strong.
Figure 4: Strong operating signals support exposure while oil-price risk limits the allocation.
Financials - Overweight
We retain the Financials overweight, with greater attention to its deteriorating market signals. Five indicators are bullish, six bearish, and two neutral. Loan growth, earnings yield, economic surprises, volatility, and drawdown measures are supportive. Momentum, total-return trend, financial-institution credit spreads, the dollar, and the yield-curve relationship are bearish. This is a qualified overweight, not a claim that the model is uniformly favorable.
The earnings case remains better than it was at midyear. FactSet’s expected third-quarter sector earnings have increased 1.9% since June 30, and 42 of 76 companies have received higher EPS estimates. Expected year-over-year earnings growth rose from 1.3% to 3.3%. Estimates slipped during the latest week, however, so the longer improvement needs monitoring. The sector’s forward P/E of 14.5 is close to its five-year average of 14.6 and below the broad market’s multiple.
Banks, insurers, exchanges, and asset managers provide different exposures to an expanding economy. Loan demand and reinvestment income can support some businesses, while trading and fee revenue support others. Higher rates are not an unqualified benefit. Deposits can reprice, securities portfolios can lose value, and stressed borrowers can require larger reserves.
The overweight therefore rests on improving quarterly estimates and relatively restrained valuation, with credit and market confirmation setting the limits. Continued estimate reductions or broader weakness in financial credit would weaken the case. We do not rely on a simple “higher rates help banks” argument when our yield-curve indicator is negative.
Figure 5: Earnings and valuation support the overweight while trend and credit signals warrant caution.
Health Care - Underweight
We reduce Health Care from neutral to underweight. Demand for treatment is durable, but sector profits depend on reimbursement, utilization, product cycles, and the cost of delivering care. The latest evidence does not justify assuming that defensive demand will translate into defensive earnings.
FactSet projects third-quarter earnings growth of 5.9%, down from 8.7% expected at June 30. Aggregate earnings estimates have declined 2.6%, and 40 of 60 companies have received lower EPS forecasts. Incyte and Pfizer were the largest contributors to the decline in expected earnings. Meanwhile, the sector’s forward P/E of 18.6 exceeds its five-year average of 17.4. The combination leaves less valuation protection against further disappointments.
60% of the indicators are bearish. Relative trend, sector trend, and breadth are favorable. Momentum, reversal, drawdown, medical-inflation, health-spending, and book-yield measures are not. The positive technical signals deserve recognition, but they have not been accompanied by improving earnings expectations.
An underweight reduces exposure to that mismatch while allowing participation in successful product launches and procedure growth. Before adding broadly, we would want fewer estimate cuts and firmer evidence that revenue growth is reaching the bottom line. Innovation remains valuable. The allocation needs evidence that investors are being paid adequately for the policy, product, and operating risks.
Figure 6: Broad estimate reductions outweigh improving trend and breadth.
Industrials - Underweight
Industrials is underweighted in October. The sector includes compelling capital-investment businesses, but the price paid for that exposure matters. FactSet’s forward P/E of 22.8 is above both the five-year average of 20.9 and the ten-year average of 20.0. Investors are already recognizing much of the opportunity in infrastructure, automation, aerospace, and electrical equipment.
The earnings forecast remains constructive. Third-quarter profits are expected to rise 14.9% and revenue 9.0%. Yet August manufacturing output fell 0.3%, and September’s flash PMI identified higher costs and supply constraints alongside faster demand. Freight-intensive businesses face a different profit equation from equipment companies with strong pricing and order books. A rising manufacturing survey does not remove that distinction.
Trend, RSI, cash-flow yield, industrial commodities, and industrial production indicators are favorable. Both momentum measures, volatility, new lows, sales yield, oil, and the dollar relationship are bearish. Consumer confidence is neutral within the model. The balance supports an underweight even though several fundamental themes remain attractive.
We would require better relative momentum and broader participation before increasing exposure. Strong orders can eventually justify a premium, but delays, expensive inputs, and weaker demand in other industries can make those profits harder to deliver. The allocation reflects that hurdle while preserving exposure to the sector’s longer-term investment opportunities.
Figure 7: Attractive investment themes face demanding valuations and uneven confirmation.
Information Technology - Overweight
Technology remains our clearest overweight. All but one indicator is bullish, spanning momentum, both overbought/oversold measures, sales yield, inflation expectations, and earnings-revision breadth. Relative short interest is the lone bearish signal. The earnings evidence provides unusually broad support for those readings.
FactSet projects third-quarter earnings growth of 63.5% and revenue growth of 39.7%. Since June 30, 59 of 74 Technology companies have received higher EPS estimates. Technology also accounts for 44 of the 72 S&P 500 companies issuing positive third-quarter EPS guidance. Positive guidance means management’s forecast exceeded the consensus estimate at the time, not merely that management sounded optimistic.
Semiconductors remain the largest contributor, with projected earnings growth of 126%. Excluding that industry, Technology earnings are still expected to rise 24.2%. That distinction matters. It shows that the profit case extends beyond chips, even though the pace of growth is not uniform across software, services, hardware, and networking. The sector’s forward P/E of 21.6 is below its own five-year average of 25.6, although it remains above the market multiple.
The overweight reflects that combination of revisions, projected growth, and market confirmation. It does not assume every AI investment will earn an adequate return. Customer spending concentration, supply constraints, competition, and eventual depreciation costs remain important risks. We would reassess if estimate breadth weakened or the relative trend stopped confirming the profit outlook. For now, Technology offers the strongest evidence that increased investment is being converted into earnings.
Figure 8: Broad upward revisions reinforce Technology’s favorable model readings.
Materials – Modest Overweight
We increase Materials from neutral to a modest overweight. Half of the composite’s indicators are now bullish. Momentum, deviation from trend, volatility, copper, gold, sales yield, and materials production support the change. The moving-average and broader trend measures remain bearish, as do emerging-versus-developed-market momentum, silver, natural gas, and earnings yield. Improvement is visible, but incomplete.
The earnings data explain why the overweight is modest. FactSet projects third-quarter earnings growth of 29.7%, with growth across metals and mining, packaging, chemicals, and construction materials. However, aggregate estimates have been cut 8.9% since June 30, and 19 of 25 companies have received lower EPS forecasts. We are not describing this as an earnings-revision recovery. Dow and Newmont were the largest contributors to the dollar decline in estimates.
Valuation provides some room for that uncertainty. The sector’s forward P/E was 17.0, compared with a five-year average of 17.9 and a ten-year average of 17.8. Business investment in electrical networks, computing infrastructure, and industrial capacity can support demand for selected materials. Expensive energy, uneven construction demand, and excess capacity can work in the opposite direction.
The allocation is a measured response to improving market and commodity signals at a less demanding valuation. It is smaller than a broad endorsement of the commodity cycle would imply. Stabilizing estimates and stronger relative trends would improve the case. Renewed deterioration in copper momentum or continued widespread estimate cuts would challenge it.
Figure 9: Improving momentum supports a small increase despite weaker earnings estimates.
Real Estate - Neutral
Real Estate remains neutral. Relative trend, breadth, unemployment, the long-rate relationship, construction-supply production, and economic surprises. Shorter-term price measures, homebuilding, and small-business credit are bearish. The favorable model evidence supports exposure, but financing conditions argue against a broad overweight.
FactSet expects third-quarter earnings growth of 8.7% and revenue growth of 9.8%. Expected aggregate quarterly earnings were unchanged from June 30. That stability distinguishes Real Estate from sectors facing substantial estimate cuts, but it does not make every property type equally attractive. Data centers, apartments, warehouses, retail, and offices have different supply conditions and capital needs.
The 10-year Treasury yield ended September at 5.29%. Higher yields can lift refinancing costs and the return investors require from property. August housing starts were estimated at a 1.275 million annual rate, with single-family starts at 918,000. Housing data provide context for interest-sensitive demand, but residential construction should not be treated as a direct measure of the listed REIT sector.
Neutral balances stable earnings expectations and constructive breadth against debt costs and uneven property fundamentals. Long debt maturities, reliable tenants, and the ability to fund development internally are useful characteristics in this environment. We would want better financing conditions or stronger earnings revisions before increasing the allocation.
Figure 10: Stable estimates and constructive breadth balance higher financing costs.
Utilities - Neutral
Utilities remains neutral. Electricity demand and grid investment create opportunities, but their value depends on financing costs, construction discipline, and the returns regulators or customers will allow. More capital spending can expand the earnings base while also increasing debt and equity funding needs.
FactSet projects third-quarter earnings growth of 6.8%, down from 8.8% expected at June 30. The forward P/E of 15.5 is below both the five-year and ten-year averages of 18.0. That valuation is more accommodating than it was historically, although a lower multiple can also reflect the higher return now available from bonds.
The indicators within the composite are mixed. Momentum, an overbought/oversold measure, capacity utilization, and dividend yield are favorable. Moving-average trend, price reversals, deviation from trend, breadth, oil, the earnings-yield spread to Treasuries, and manufacturing PMI are bearish. The dividend signal is useful, but it does not eliminate the financing concerns reflected elsewhere in the model.
Neutral preserves exposure to electricity and network investment without assuming that every utility will benefit equally from data-center demand. We would look for stronger breadth and firmer earnings estimates before adding. Lower borrowing costs would help, but the longer-term requirement is profitable investment that does not place excessive pressure on the balance sheet or customer bills.
Figure 11: Valuation and electricity investment support exposure while financing and breadth limit conviction.
Catastrophic Stop Update
The Catastrophic Stop model combines time-tested, objective indicators designed to identify high-risk periods for the equity market. The model entered October recommending a fully invested equity allocation relative to the benchmark.
The evidence does not currently indicate broad deterioration associated with a major downtrend. If the model falls below 40% for two consecutive days, the strategy will raise cash under its rules.
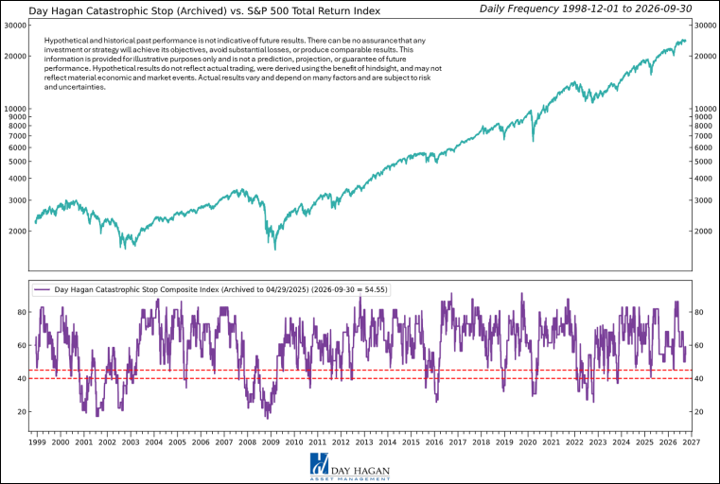
Figure 12: The Catastrophic Stop model recommends a fully invested equity position relative to the benchmark.
Hypothetical and historical past performance is not indicative of future results. There can be no assurance that any investment or strategy will achieve its objectives or avoid substantial losses or have comparable results. This information is provided for illustrative purposes only and is not a prediction, projection, or guarantee of future performance. Hypothetical results do not reflect actual trading, were derived using the benefit of hindsight, and may not reflect material economic and market events. Actual results vary and depend on many factors and subject to risk and uncertainties.
Our goal is to stay aligned with the prevailing trend and introduce risk management when conditions deteriorate. Growth, liquidity, earnings, and equity demand remain constructive, while inflation, long rates, oil, and consumer confidence deserve attention. The Catastrophic Stop remains positive. If it shifts to bearish levels, our discipline will call for raising cash.
The strategy uses price, valuation, economic, liquidity, and sentiment measures to guide allocation. Company references illustrate sector conditions and are not recommendations.
Day Hagan Asset Management
1000 S. Tamiami Trl
Sarasota, FL 34236
Toll Free: (800) 594-7930
Office Phone: (941) 330-1702
Website: https://dayhagan.com or https://dhfunds.com
This material is for educational purposes only. Further distribution is prohibited without prior permission. Please see the information on Disclosures and Fact Sheets here: https://dhfunds.com/literature. Charts with models and return information use indices for performance testing to extend the model histories, and they should be considered hypothetical. All Rights Reserved. (© Copyright 2026 Day Hagan Asset Management.)
Day HaganSmart Sector®
With Catastrophic Stop ETF
Symbol: SSUS
Disclosures
The data and analysis contained within are provided “as is” and without warranty of any kind, either express or implied. The information is based on data believed to be reliable, but it is not guaranteed. Day Hagan DISCLAIMS ANY AND ALL EXPRESS OR IMPLIED WARRANTIES, INCLUDING, BUT NOT LIMITED TO, ANY WARRANTIES OF MERCHANTABILITY, SUITABILITY, OR FITNESS FOR A PARTICULAR PURPOSE OR USE. All performance measures do not reflect tax consequences, execution, commissions, and other trading costs, and as such, investors should consult their tax advisors before making investment decisions, as well as realize that the past performance and results of the model are not a guarantee of future results. The Smart Sector® Strategy is not intended to be the primary basis for investment decisions, and the usage of the model does not address the suitability of any particular investment for any particular investor.
Using any graph, chart, formula, model, or other device to assist in deciding which securities to trade or when to trade them presents many difficulties, and their effectiveness has significant limitations, including that prior patterns may not repeat themselves continuously or on any particular occasion. In addition, market participants using such devices can impact the market in a way that changes the effectiveness of such devices. Day Hagan believes no individual graph, chart, formula, model, or other device should be used as the sole basis for any investment decision and suggests that all market participants consider differing viewpoints and use a weight-of-the-evidence approach that fits their investment needs.
Past performance does not guarantee future results. No current or prospective client should assume future performance of any specific investment or strategy will be profitable or equal to past performance levels. All investment strategies have the potential for profit or loss. Changes in investment strategies, contributions or withdrawals, and economic conditions may materially alter the performance of your portfolio. Different types of investments involve varying degrees of risk, and there can be no assurance that any specific investment or strategy will be suitable or profitable for a client’s portfolio. Historical performance results for investment indexes and/or categories generally do not reflect the deduction of transaction and/or custodial charges or the deduction of an investment management fee, the incurrence of which would have the effect of decreasing historical performance results. There can be no assurances that a portfolio will match or outperform any particular benchmark. Comparisons to indices are inherently unreliable indicators of future performance. The strategies used to generate the performance vary from those used to generate the returns depicted in the benchmarks. Investors cannot directly invest in an index.
The information contained herein is provided for informational purposes only and should not be construed as investment advice or a recommendation to buy or sell any security. The securities, instruments, or strategies described may not be suitable for all investors, and their value and income may fluctuate. Past performance is not indicative of future results, and there is no guarantee that any investment strategy will achieve its objectives, generate profits, or avoid losses.
This material is intended to provide general market commentary and should not be relied upon as individualized investment advice. Investors should consult with their financial professional before making any investment decisions based on this information.
Data and analysis are provided “as is” without warranty of any kind, either express or implied. Day Hagan Asset Management, its affiliates, employees, or third-party data providers shall not be liable for any loss sustained by any person relying on this information. All opinions and views expressed are subject to change without notice and may differ from those of other investment professionals within Day Hagan Asset Management or Ashton Thomas Private Wealth, LLC.
Accounts managed by Day Hagan Asset Management or its affiliates may hold positions in the securities discussed and may trade such securities without notice.
Day Hagan Asset Management is a division of and doing business as (DBA) Ashton Thomas Private Wealth, LLC, an SEC-registered investment adviser. Registration with the SEC does not imply a certain level of skill or training.
There is no guarantee that any investment strategy will achieve its objectives, generate dividends, or avoid losses.
This material is for educational purposes only. Further distribution is prohibited without prior permission. Please see the information on Disclosures and Fact Sheets here: https://dhfunds.com/literature. Charts with models and return information use indices for performance testing to extend the model histories, and they should be considered hypothetical. All Rights Reserved. (© Copyright 2026 Day Hagan Asset Management.)
Sources:
[1] FactSet Earnings Insight, September 25, 2026. Supplied report. Pages 1, 3, 9–13, 25, and 32. Sector estimates, guidance, analyst ratings, and valuations. Source link
[2] S&P Global, September flash U.S. PMI commentary, released September 23, 2026. Source link
[3] Federal Reserve, September 16, 2026 FOMC statement. Source link
[4] U.S. Treasury, Daily Treasury Par Yield Curve Rates. August 31 and September 30, 2026. These are official daily par yields, not a particular bond’s closing trade. Source link
[5] BEA, Personal Income and Outlays, August 2026. Released September 30, with the annual revisions. Source link
[6] The Conference Board, September Consumer Confidence. Released September 29, 2026. Source link
[7] Federal Reserve, August Industrial Production and Capacity Utilization. Released September 18, 2026. Source link
[8] AAII Sentiment Survey, week ended September 23, 2026, released September 24. Later survey results are excluded from the September 30 information cutoff. Source link
[9] U.S. Census Bureau and HUD, August New Residential Construction. Released September 17, 2026. Preliminary estimates are subject to sampling error and revision. Source link
[10] Reuters, September 30 global market close. WTI settlement and monthly change, with the geopolitical and fuel-market context. Source link
Portfolio outlooks and sector indicator readings were supplied by Day Hagan for the October allocation.
Definitions
Sector Composite Models — Day Hagan Sector Composite Models use quantitative, rules-based indicators to evaluate relative sector conditions across trend, momentum, valuation, breadth, macroeconomic, and sentiment inputs. The models are designed to support disciplined sector allocation decisions. Hypothetical and historical past performance is not indicative of future results. There can be no assurance that any investment or strategy will achieve its objectives, avoid substantial losses, or have comparable results. This information is provided for illustrative purposes only and is not a prediction, projection, or guarantee of future performance. Hypothetical results do not reflect actual trading, were derived using the benefit of hindsight, and may not reflect material economic and market events. Actual results vary and depend on many factors and are subject to risks and uncertainties.
S&P 500 — A stock market index tracking 500 of the largest publicly traded U.S. companies; commonly used as a benchmark for the overall U.S. equity market.
Dow Jones Industrial Average (DJIA) — A price-weighted stock index of 30 large U.S. companies, often used as a headline measure of the stock market.
Nasdaq Composite — A stock market index that includes thousands of stocks listed on the Nasdaq exchange, with heavy exposure to technology companies.
PMI (Purchasing Managers’ Index) — A survey-based economic indicator that measures business activity; readings above 50 generally indicate expansion, while readings below 50 indicate contraction.
ISM (Institute for Supply Management) Index — A widely followed U.S. manufacturing activity index based on purchasing manager surveys; used to gauge economic momentum.
CPI (Consumer Price Index) — A measure of inflation that tracks changes in the prices consumers pay for goods and services.
Medical CPI — A CPI subcategory that measures inflation specifically in medical care goods and services.
Federal Reserve (the Fed) — The central bank of the United States, responsible for setting monetary policy and influencing interest rates and financial conditions.
Benchmark weighting — The percentage weight a sector or asset has in a benchmark index, used as a reference point for portfolio positioning.
Overweight — A portfolio position above the benchmark weighting, reflecting a more favorable view of that sector or asset.
Underweight — A portfolio position below the benchmark weighting, reflecting a less favorable view of that sector or asset.
Neutral — A portfolio position roughly in line with the benchmark weighting, indicating no strong directional preference.
Sector rotation — A market dynamic in which investors shift money between sectors based on changing economic, interest-rate, or earnings expectations.
Relative strength — A measure of how a stock, sector, or asset performs compared with a benchmark or another asset.
Breadth — A technical measure showing how broadly market participation is spread, such as how many stocks in a sector are advancing or hitting new highs/lows.
RSI (Relative Strength Index) — A technical momentum indicator used to assess whether an asset may be overbought or oversold.
Yield curve — The relationship between yields on short- and long-term Treasury securities; changes in its shape can signal shifts in economic expectations.
10Y-2Y spread — The difference between the 10-year and 2-year U.S. Treasury yields, often used as a quick measure of the yield curve’s steepness.
WTI crude — West Texas Intermediate crude oil, a key U.S. benchmark price for oil.
REITs (Real Estate Investment Trusts) — Companies that own, operate, or finance income-producing real estate and typically trade like stocks.
© 2026 Day Hagan Asset Management