
Day Hagan Smart Sector® with Catastrophic Stop Strategy Update June 2024
A downloadable PDF copy of the Article:
Day Hagan Smart Sector® with Catastrophic Stop Strategy Update June 2024 (pdf)
Catastrophic Stop Update
The Catastrophic Stop model combines time-tested, objective indicators designed to identify high-risk periods for the equity market. The model (Figure 1) increased during May and entered June with a fully invested equity allocation recommendation.
Figure 1: Smart Sector® Catastrophic Stop Sell Model
The recent increase in the Catastrophic Stop model was primarily influenced by the Daily Sentiment Composite shifting from Excess Optimism to the Neutral zone (Figure 2). It's important to consider the historical perspective here: since 2006, the S&P 500 has delivered a positive, though muted, annualized return of 5.08% when the composite was between 41.5% and 62.5%. This historical data provides a valuable context for potential near-term returns.
Figure 2: S&P 500 vs. NDR Daily Trading Sentiment Composite.
All other technical measures within the Catastrophic Stop models remain bullish, with the exception of the Breadth Thrust and Oversold Mean Reversion factors, which are neutral. Overall, the model’s external (operating environment-related) indicators remain positive, though indicators evaluating the economic landscape are showing signs of fatigue. Importantly, measures of financial stress, such as the High Yield Option Adjusted Spreads factor (Figure 3), indicate that the probability of an extended downturn is relatively low.
Figure 3: High Yield OAS Factor vs. S&P 500 Total Return Index
Sector Outlook
Sector
Consumer Discretionary
Consumer Staples
Communication Services
Energy
Financials
Health Care
Industrials
Information Technology
Materials
Real Estate
Utilities
Outlook (relative to benchmark weighting)
Underweight
Underweight
Underweight
Neutral
Neutral
Neutral
Underweight
Overweight
Underweight
Underweight
Overweight
Sector Commentary
With this month’s rebalance, we are adjusting the portfolio to true up exposure to several large companies within the “Magnificent 7” that were capped due to exchange-traded fund regulations. In short, capping regulations can cause certain holdings within sector-specific ETFs to be capped at lower levels than what is held in the corresponding GICs-sector benchmarks.
For example, NVIDIA (NVDA) is capped at 4.5% in the XLK ETF yet holds a 17.0% position in the actual benchmark Information Technology sector index. In the Communication Services sector ETF, both share classes of Alphabet (GOOG, GOOGL) are weighted at a combined 23% versus 31.1% in the benchmark Communication Services sector index. (Capping data as of 3-18-2024.) With NVDA up 121% and GOOG up 23.4% year to date, the difference accounts for more than 400 bps of underperformance this year versus the index benchmarks.
To account for the difference in weightings, we are adding positions in the SMH (Semiconductor) and MAGS (Magnificent 7) ETFs. This will bring our actual holdings closer to the benchmark index weightings and mute this divergence in the future.
Sector Review
Consumer Discretionary: We remain underweight, with the sector up just 0.4% YTD (second-worst performer behind Real Estate). In fact, the sector is well below its 2021 high. Price-related indicators and those evaluating the sector’s operating environment remain negative. Specifically, measures of trend, overbought/oversold, momentum, higher rates, and discretionary consumer spending urge caution. With the U.S. economy slowing in Q1 and Q2 estimates trending lower, this sector is expected to face continued headwinds. We continue to monitor consumer credit conditions and earnings surprises, as both factors are rated positive and could provide support once the technical picture improves.
Figure 4: Higher rates negatively impacting consumer spending and consumer discretionary stocks.
Consumer Staples: The underweight allocation is supported by very weak internal (technical) and external (operating environment) indicators. Measures of trend, OBOS, breadth, valuation, food inflation, growth in food sales, and the cumulative short-interest ratio for staples stocks are negative. While PG, COST, WMT, KO, and PEP are often considered “steady” stocks, the sector’s various valuation measures are trending toward the high end of the 20-year range.
Figure 5: Consumer Staples Forward P/E shows defensive stocks are not a bargain.
Communication Services: The model started getting more cautious in February, after being overweight at the beginning of the year when much of the sector’s gains were achieved. Most internal and external indicators are negative, including trend, OBOS, momentum, volatility, valuations, earnings revisions, sector-specific credit spreads, and internet sales. Interestingly, the Forward P/E for the sector is 19.2x, below that of the Consumer Staples sector. Nonetheless, recent pullbacks in the two largest constituents, Meta and Alphabet, are negatively impacting the model.
Figure 6: The Breadth of Positive Earnings Revisions for Communication Services is rolling over.
Energy: Year to date, allocations to the Energy sector have ranged from Overweight to the current neutral level. Both the Internal and External indicators are mixed. For example, negative factors include momentum, OBOS, rolling volatility, valuation (based on cash flow), and inventories. Positive supports include breadth improvement, pessimistic crude futures crowd sentiment, crude spot prices, and the U.S. dollar. At this juncture, the weight of the evidence is inconclusive as the model seeks to identify the next major trend. Until it does, we will remain with a neutral allocation.
Figure 7: Inventory levels continue to drop (especially the SPR). When the Crude Oil Days of Supply indicator below drops below the lower bracket and reverses higher, it has historically been a good sign that inventories are starting to be replenished. With the sector’s Forward P/E at 11.85x, we are watching closely for the next opportunity.
Financials: The sector is now rated neutral (from overweight) due to model readings shifting more negatively. Bank loan growth has been declining, recent G10 economic releases have been missing expectations, valuations are average (though expensive when looking at just Price/Book), the sector is overbought, and volatility has been increasing. The positive news is that business credit conditions are still supportive (though fewer are seeking loans), and credit spreads on financial institutions’ debt are still relatively narrow. The net result is that we are reducing exposure to the sector and will look for model improvement before adding back.
Figure 8: The Citi G10 Economic Surprise Index shows that recent economic releases have been missing expectations. This has historically been a headwind for the Financials sector.
Health Care: The sector’s technical indicators are mixed, but the operating environment is starting to improve. Indicators calling medical CPI, HC company aggregate book values, and aggregate HC company credit spreads are supportive. Additionally, personal expenditures for health care are gradually increasing. We are maintaining our neutral allocation until the technical indicators turn more positive, indicating that the overall trend has likely reversed.

Figure 9: Inflation for medical products and services is bad for everyone except the providers.
Industrials: The Industrials sector is underweight, keeping the cautious theme around cyclicals intact. The internal model is uniformly negative, while external indicators are more mixed. Measures of momentum, trend, RSI, and volatility are negative. Similarly, valuations remain at the higher end of the 20-year range, while economic activity is showing signs of slowing. While obvious factors support aerospace and defense (about 16.8% of the sector), economic uncertainty remains a headwind.

Figure 10: Sector volatility has declined to levels setting it up for a buy signal. When it occurs, we will look to increase exposure.
Information Technology: We are slightly overweight on the sector, with Internal and External indicators mixed. Measures of momentum, breadth, net new highs, valuation, and increasing market-based inflation expectations are negative. Earnings revisions, short interest building again, and better results throughout the Emerging Asia region are supportive. We also note that overbought conditions are in place but have yet to reverse from the extremes. Those indicators will flip to sell signals when this occurs, indicating that the sector’s uptrend is likely to pause.
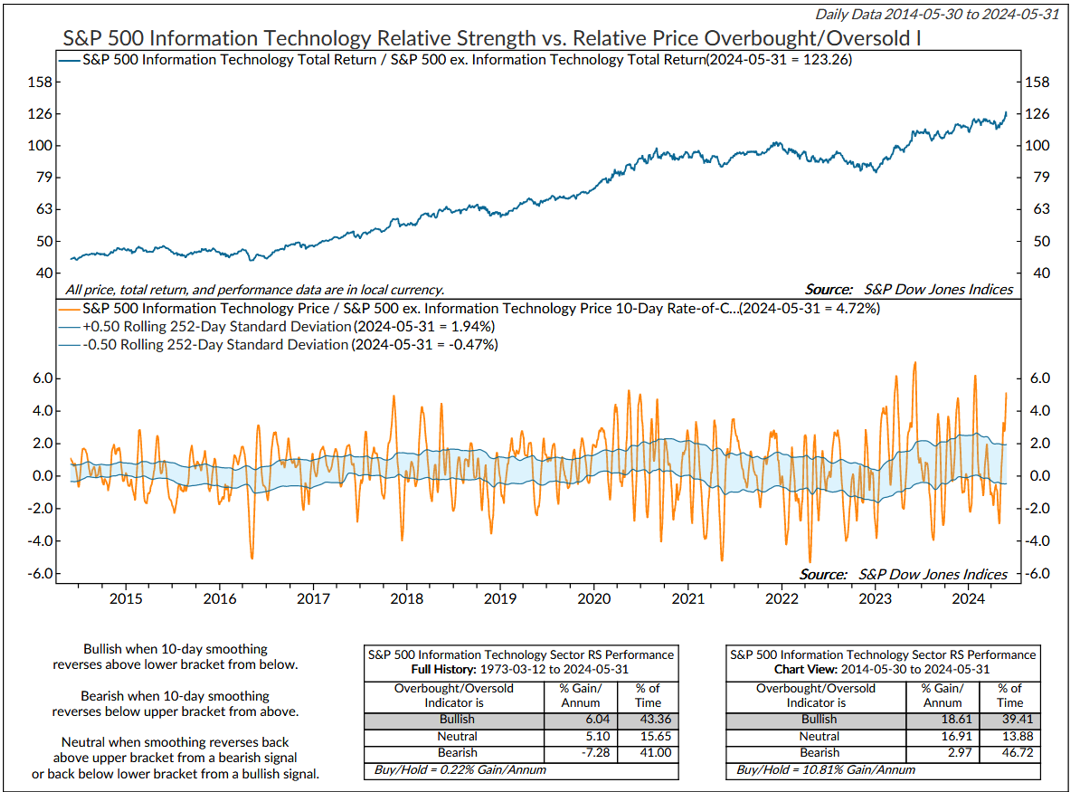
Figure 11: Go with the flow until it reaches an extreme and reverses. This particular OBOS indicator will flip to a sell signal when the 10-day rate of change declines below the top bracket.
Materials: We are currently slightly underweight. While uptrends in copper, silver, and gold are encouraging, we note that, like the other cyclical plays mentioned in this publication, concerns are growing around the possibility of decelerating economic growth. Technical indicators are mixed, and measures of valuation and industrial production (for materials) remain weak. In our view, green hydrogen is an underappreciated opportunity, and with Linde PLC (LIN) at 20.6% of the index aggressively investing in the space, there is upside potential down the road. We will look to upgrade when the technical indicators confirm an uptrend is developing.
Figure 12: Copper prices dovetail with trends in the Materials sector. Copper prices look extended based on the indicator below. A drop below the lower bracket would generate a sell signal.
Real Estate: We are underweight the sector. CRE is still a risk, with over $1 trillion in CRE loans coming due throughout the rest of this year. Based on Q1 earnings, aggregate FFO was flat, but the divergence by sector was stark. Retail, telecommunications, and apartment FFOs were solid. Industrial and office REITs were weak. The model’s technical indicators are uniformly bearish, while the external backdrop is mixed, based on an evaluation of employment, interest rate trends, industrial production for construction supplies, business credit conditions, and economic activity.
Figure 13: The sector’s Internal Model is max negative. As we know, bull markets begin at bear market bottoms. As the model improves, we will add back exposure.
Our goal is to stay on the right side of the prevailing trend, introducing risk management when conditions deteriorate. Currently, the uptrend remains intact. As has been the case for all of 2024, the broader-based composite models calling U.S. economic growth, international economic growth, inflation trends, liquidity, and equity demand remain constructive. The Catastrophic Stop model is positive, and we are aligned with the message. If our models shift to bearish levels, we will raise cash.
This strategy utilizes measures of price, valuation, economic trends, monetary liquidity, and market sentiment to make objective, unemotional, rational decisions about how much capital to place at risk and where to place that capital.
For more information, please contact us at:
Day Hagan Asset Management
1000 S. Tamiami Trl
Sarasota, FL 34236
Toll Free: (800) 594-7930
Office Phone: (941) 330-1702
Website: https://dayhagan.com or https://dhfunds.com
Charts courtesy Ned Davis Research (NDR). © Copyright 2024 NDR, Inc. Further distribution prohibited without prior permission. All Rights Reserved. See NDR Disclaimer at www.ndr.com/copyright.html. For data vendor disclaimers refer to www.ndr.com/vendorinfo.
Day Hagan/Ned Davis Research
Smart Sector® With Catastrophic Stop ETF
Symbol: SSUS
Disclosures
The data and analysis contained within are provided "as is" and without warranty of any kind, either express or implied. The information is based on data believed to be reliable, but it is not guaranteed. Day Hagan DISCLAIMS ANY AND ALL EXPRESS OR IMPLIED WARRANTIES, INCLUDING, BUT NOT LIMITED TO, ANY WARRANTIES OF MERCHANTABILITY, SUITABILITY, OR FITNESS FOR A PARTICULAR PURPOSE OR USE. All performance measures do not reflect tax consequences, execution, commissions, and other trading costs, and as such, investors should consult their tax advisors before making investment decisions, as well as realize that the past performance and results of the model are not a guarantee of future results. The Smart Sector® Strategy is not intended to be the primary basis for investment decisions and the usage of the model does not address the suitability of any particular in Fixed Income vestment for any particular investor.
Using any graph, chart, formula, model, or other device to assist in deciding which securities to trade or when to trade them presents many difficulties and their effectiveness has significant limitations, including that prior patterns may not repeat themselves continuously or on any particular occasion. In addition, market participants using such devices can impact the market in a way that changes the effectiveness of such devices. Day Hagan believes no individual graph, chart, formula, model, or other device should be used as the sole basis for any investment decision and suggests that all market participants consider differing viewpoints and use a weight-of-the-evidence approach that fits their investment needs.
Past performance does not guarantee future results. No current or prospective client should assume future performance of any specific investment or strategy will be profitable or equal to past performance levels. All investment strategies have the potential for profit or loss. Changes in investment strategies, contributions or withdrawals and economic conditions may materially alter the performance of your portfolio. Different types of investments involve varying degrees of risk, and there can be no assurance that any specific investment or strategy will be suitable or profitable for a client’s portfolio. Historical performance results for investment indexes and/or categories generally do not reflect the deduction of transaction and/or custodial charges or the deduction of an investment management fee, the incurrence of which would have the effect of decreasing historical performance results. There can be no assurances that a portfolio will match or outperform any particular benchmark.
Day Hagan Asset Management is registered as an investment adviser with the United States Securities and Exchange Commission. SEC registration does not constitute an endorsement of the firm by the Commission nor does it indicate that the adviser has attained a particular level of skill or ability.
There may be a potential tax implication with a rebalancing strategy. Re-balancing involves selling some positions and buying others, and this activity results in realized gains and losses for the positions that are sold. The performance calculations do not reflect the impact that paying taxes would have, and for taxable accounts, any taxable gains would reduce the performance on an after-tax basis. This reduction could be material to the overall performance of an actual trading account. Day Hagan does not provide legal, tax or accounting advice. Please consult your tax advisor in connection with this material, before implementing such a strategy, and prior to any withdrawals that you make from your portfolio.
There is no guarantee that any investment strategy will achieve its objectives, generate dividends or avoid losses.
© 2024 Day Hagan Asset Management
