
Day Hagan Smart Sector® with Catastrophic Stop Strategy Update July 2025
A downloadable PDF copy of the Article:
Day Hagan Smart Sector® with Catastrophic Stop Strategy Update July 2025 (pdf)
Executive Summary
In June, the S&P 500 saw a significant increase of about 4.96%, marking its third-consecutive monthly gain after a challenging spring of policy shocks in April. This surge was fueled by supportive corporate earnings, decreasing volatility, and a normalization of trade tensions. Year-to-date, the index had risen approximately 5.5%, with a 12-month increase of more than 13.6%. Keep in mind, this strong performance followed May’s increase of 6.15%, the best May since 1990. Given the spike in performance from the April lows and the near-term increase in overbought conditions this move has created, we remain fully invested; however, our sector models have shifted in favor of sectors with higher relative cyclical and defensive characteristics.
Sector performance for June shows nine out of eleven sectors posting gains. Leading the pack was Information Technology, which gained 9.7% thanks to a rebound in large-cap tech stocks and renewed enthusiasm for AI-related advancements. Communication Services followed closely with a 7.2% increase, boosted by cyclical demand and optimism about deregulation and lower tariffs. In contrast, other sectors experienced more modest gains, underperforming the broader index. Financials and Utilities saw steady increases, aided by favorable deregulation trends and stable yield conditions. The Energy sector lagged slightly due to subdued oil prices and ongoing concerns about global demand. Healthcare and Materials also finished higher, although the strength of more cyclical sectors overshadowed their performance. Real Estate and Consumer Staples were negative for the quarter.
Investor confidence was reinforced by corporate earnings data, which revealed year-over-year profit growth of approximately 9.6% in Q1. The Federal Reserve struck a delicate balance by maintaining high interest rates while hinting at potential cuts in late 2025 and early 2026, creating a supportive backdrop for equities. Additionally, the resolution of tariff escalations in May, including a pause on EU tariffs and a temporary U.S.-China agreement, helped de-escalate trade risks and stabilize business sentiment.
A favorable Supreme Court decision limiting universal injunctions suggested further regulatory relief for banks, industrial companies, energy companies, and technology companies. On the global front, easing tensions in the Middle East and stabilized oil prices encouraged a risk-on investment strategy.
International equities, particularly in European and Latin American markets, outperformed U.S. benchmarks early in Q2, adding modest upward pressure on global capital flows. Currency stability and a decline in implied volatilities (with the VIX remaining below 20) contributed to a calmer market environment, even amid geopolitical risks, such as U.S.-China tariff disputes and Israel-Iran tensions.
S&P equal-weighted performance, approximately 4.7% year-to-date, lagged behind the cap-weighted index, indicating that a select few tech and cyclical stocks dominated returns. Concerns over increasing valuations emerged as the forward P/E ratio rose to around 22.2, the highest level since February.
Global equities also performed well in June, driven by a confluence of dovish central bank policies, divergent economic releases, and gyrating trade dynamics in the U.S., China, the Eurozone, Canada, Japan, and the Pacific region. The U.S. Federal Reserve’s decision to hold interest rates steady at 4.25%-4.50% initially set a cautious tone, due to an upward revision of its 2025 inflation forecast to 3.1% reflecting concerns over potential tariff-driven price pressures. This tempered expectations for rate cuts, contributing to market uncertainty. However, Fed projections indicate that inflation is expected to increase through 2025 and moderate quickly thereafter, while international inflation statistics generally shifted lower.
Economic data presented more of a mixed picture: In the U.S., robust job growth signaled labor market resilience, but a 0.5% contraction in GDP, driven by weaker consumer spending and exports, raised concerns. Projections of a stronger Q2 (illustrated by the Atlanta Fed’s GDPNow model), alongside a services PMI rebound, provided some optimism, particularly for technology-focused sectors.
In summary, June delivered broad gains across the S&P 500, with strong performances in the cyclical and tech sectors. Supportive earnings, declining macro risks, and clearer policies underpinned this momentum. However, elevated valuations and geopolitical uncertainties warrant caution about future sustainability, with market breadth being crucial for continued gains beyond the dominance of major players.
Turning to our primary equity risk model, the Day Hagan Catastrophic Stop model level is 77.27% (100 = best). The model indicates that investors should maintain their benchmark equity exposure.
Measures evaluating recent breadth thrusts, oversold mean reversion probabilities, investor sentiment, longer-term trends, volume-adjusted supply versus demand, relative stock versus bond trends, credit spreads, and economic activity are supportive. We note that several indicators are positioned to shift to sell signals should upside momentum start to fade.
The weight of the evidence suggests that the recent decline is not expected to extend into a significant downtrend. Of course, if our model flips negative (below 40% for two consecutive days), signaling more substantial problems, we will raise cash immediately.
The message of the models is to maintain a full equity benchmark allocation.
Holdings
Sector
Consumer Discretionary
Consumer Staples
Communication Services
Energy
Financials
Health Care
Industrials
Information Technology
Materials
Real Estate
Utilities
Outlook (relative to benchmark weighting)
Neutral
Overweight
Overweight
Neutral
Neutral
Neutral
Neutral
Neutral
Modestly Overweight
Neutral
Underweight
Sector Review
Consumer Discretionary: The Composite model declined into July, and we have reduced exposure. Measures of short-term trend and relative price momentum are negative. However, breadth measures and relative net new highs are bullish. Importantly, discretionary consumer spending has rolled over, which supports the reduction in exposure to neutral.
Commentary: The S&P 500 Consumer Discretionary sector rose 2.1% in June, underperforming the broader index. The sector was supported by stable wage growth and easing inflation but faced headwinds from softening consumer sentiment and uneven demand. Discount retailers, such as Five Below and Dollar General, posted solid gains due to persistent value-oriented shopping, while middle-tier department stores, like Kohl’s and Macy’s, lagged amid traffic declines and margin pressure. Auto manufacturers delivered mixed results. Tesla shares declined following a year-over-year drop in Q2 deliveries, while GM rose modestly on robust pickup truck sales and improved North American margins. Apparel and furnishings retailers continued to struggle with elevated inventories and discounting activity, which compressed their gross margins. Earnings expectations for the sector were revised down 4-5% during the month, driven by cautious guidance tied to trade-related cost risks and slowing discretionary outlays. Ongoing tariff uncertainty, particularly related to Chinese imports, prompted several firms to adjust sourcing strategies and revise cost assumptions. While the sector advanced modestly, performance remained dependent on macro factors, including real income trends, inventory normalization, and geopolitical developments tied to consumer goods trade.
Figure 1: A reversal in interest rates would be bullish for the Consumer Discretionary sector (and the market in general).
Consumer Staples: Measures of short-term trend, relative price momentum, relative net new highs, breadth, food sales increases, short interest, and decelerating economic growth projections support this defensive play. There are some signs of near-term overbought conditions and a moderation in food price inflation (good for America, not as good for food company profits), which are headwinds. The net result is an overweight (7.25% vs. the benchmark weight of 5.50%).
Commentary: In June, the S&P 500 Consumer Staples sector experienced a modest decline, one of only two negative performers among S&P sectors. Margin pressure, sluggish volume trends, and cost-related shocks drove this downturn. Procter & Gamble, as a key player in the sector, announced a significant reduction of approximately 7,000 jobs—about 15% of its non-manufacturing staff—while lowering its financial guidance due to consumer reluctance, tariff challenges, inflation, and geopolitical instability. This news came after a ~2.9% year-to-date decrease in its stock. Several packaged food companies, including Kraft Heinz and General Mills, also faced underperformance, attributing it to weakening demand driven by inflationary pressures and the impact of GLP-1 medications on eating habits. Conversely, dollar-store chains benefited from an influx of value-conscious shoppers, somewhat mitigating the broader sector’s weaknesses. Input costs rose due to ongoing inflation and renewed tariff uncertainties. Despite being deemed defensive, some companies struggled to achieve sufficient pricing power to counteract rising expenses, leading to squeezed margins. As a result, earnings guidance revisions trended downward, with firms lowering full-year earnings per share by an average of 3-5%, restrained by elevated inventories and faltering consumer spending.
Figure 2: Relative breadth is improving and indicating a positive divergence for the Consumer Staples sector.
Communication Services: The composite model remains overweight, supported by indicators calling the technical and operating environment. Trend, overbought/oversold, deviation from trend, and valuations are supportive. Relative valuations and interest rate trends are also supportive.
Commentary: In June, the S&P 500 Communication Services sector experienced a significant rise of approximately 7.2%, marking its second-best monthly performance among all S&P sectors. This increase was largely driven by notable gains in Meta, which surged around 17%, and Alphabet, which contributed a smaller 9%. The sector’s strength was boosted by robust Q1 results, driven by rebounds in ad spending, cost efficiencies, and AI monetization, which led to a projected 16.5% year-over-year earnings growth. Easing tariff tensions and reduced volatility in the Middle East positively impacted sentiment across advertising-dependent businesses and content platforms, helping to sustain digital ad budgets and subscription growth. However, risks remain, with elevated forward earnings multiples and signs of slowing service-sector activity—evidenced by the ISM services PMI hovering near critical levels—raising caution. While names like Disney, Comcast, and Verizon also posted modest gains due to resilient consumer spending and stable telecom infrastructure, analysts highlighted the vulnerability to potential dips in advertising and content spending, emphasizing that growth momentum hinges on continued strong performance from major players and broader macroeconomic stability.
Figure 3: Even with the outperformance of late, the relative earnings yield for Communication Services remains higher than the overall market.
Energy: The composite model improved, with measures of relative strength, oversold conditions, inventories, rig count, and the U.S. dollar indicating bullish conditions. We have modestly increased exposure.
Commentary: The S&P 500 Energy sector rose roughly 4.7% in June, lagging behind broader equities due to fluctuating oil prices influenced by supply dynamics and geopolitical events. OPEC+ increased oil output by approximately 267,000 barrels per day, led by Saudi Arabia and the UAE, which alleviated earlier tightness. Meanwhile, U.S. production approached record highs, near 13.5 Million Barrels per Day, but began to stabilize, contributing to seasonal volatility. Mid-month geopolitical tensions, particularly Israeli strikes on Iran, temporarily boosted Brent crude prices by about 11%, hitting the mid-$80s per barrel before retreating to the low $70s. This volatility affected exploration and production (E&P) companies, yet natural gas and refining segments thrived, with gas-focused firms like EQT rising approximately 26%, and refiners such as Valero and Marathon gaining 12–20% due to improved refining margins. Earnings reports showed mixed results; major oilfield services and E&P companies faced rising costs, while refiners benefited from refinery outages. Analysts highlighted ongoing risks, including supply increases and global demand uncertainty, yet Bank of America maintained an energy overweight stance, citing solid free cash flow, with upside contingent on oil prices staying above $60/barrel. Overall, June’s performance reflected supply shifts, geopolitical volatility, and earnings disparities across energy subsectors.
Figure 4: The 5-week point change in inventories is negative and is now in oversold territory. Improvement in the composite model’s shorter-term technical measures would support an increase in exposure.
Financials: The composite model remains neutral, supported by short-term price trends, relative oversold conditions, lower volatility, and a widening yield curve. Negative indicators include lower upside momentum, a weaker U.S. dollar, slowing bank loan growth, and modestly wider credit spreads. Valuations and business credit conditions are neutral. We are neutral.
Commentary: The S&P 500 Financials sector rose approximately 3.1% in June, fueled by robust bank earnings, improved capital returns, and stabilized trading volumes. Major U.S. banks passed the Federal Reserve’s stress tests, paving the way for increased dividends and buybacks. Consequently, the KBW-Bank Index surged 12% year-to-date, significantly outperforming the S&P 500’s 5%. Leading banks, including Bank of America, JPMorgan, Citigroup, and Wells Fargo, drove this rally amid heightened investor optimism regarding capital deployment. First-quarter data revealed that bank sector profits reached $70.6 billion, marking a 5.8% increase from the previous quarter. Non-interest income saw a notable 7% rise, compensating for slower loan growth of 0.5% quarter-over-quarter. While investment banks faced challenges—with Jefferies reporting declines in equity underwriting due to reduced deal volume—analysts remain positive. FactSet anticipates Q2 financial sector earnings growth of around 3.6%, accelerating to 9.7% in Q3. Despite this positive outlook, risks persist, including elevated interest rates that could impact trading income and loan demand, as well as potential tariff pressures on business confidence. However, expectations that the Federal Reserve will hold rates steady through July and begin cuts by September could bolster net interest margins, supporting the sector’s momentum. Overall, solid bank balance sheets and macro fundamentals underpin June’s financial results.
Figure 5: The Financials sector would benefit from a stronger U.S. dollar.
Health Care: The composite model is neutral. Negative inputs include relatively short-term trends, momentum, longer-term breadth, and a decline in healthcare personal expenditures. Positive supports include lower volatility (indicating defensive characteristics), the CPI for medical care increasing (showing healthcare pricing power remains in effect), and valuations being relatively cheaper.
Commentary: In June, the Health Care sector experienced a 1.9% gain. Insurers faced significant challenges in controlling costs. Centene’s sharp stock decline after retracting its guidance shifted market expectations, while UnitedHealth and Humana outperformed, showing early signs of easing medical cost trends. Pharmaceutical and biotech firms delivered mixed signals; several top-tier drugmakers reported positive progress in diabetes and obesity treatments, somewhat mitigating weaker performance in mid-cap stocks due to regulatory delays. The healthcare services sector benefited from a strong labor market, with 62,000 new jobs in May marking the best monthly gain in over a year. Despite elevated costs driven by wage inflation and reimbursement pressures, valuations remained above average, with the sector’s forward P/E ratio around 25, compared to a five-year average of nearly 22. Overall, June’s performance reflected insurer cost management, promising drug developments, and record staffing levels. Nonetheless, uncertainties regarding policy changes and margin pressures pose risks, but underlying trends support a cautiously positive outlook.
Figure 6: The Health Care sector is oversold. A reversal from these levels would be encouraging.
Industrials: The composite model’s level remained neutral with short-term momentum, oversold conditions, breadth, CRB trends, industrial production, and the weaker U.S. dollar positive. Increased volatility relative to history, decelerating cash flows, higher valuations (based on sales trends), and lower oil prices (causing a contraction in the energy complex) are negative. We remain neutral.
Commentary: The Industrials sector rose 3.5% in June, lagging behind the S&P 500’s gain. Strength in aerospace and defense was notable, with GE Aerospace and Howmet benefiting from increased Pentagon spending and rising commercial aircraft deliveries. Boeing also reported improved order flow, although supply chain constraints capped further growth. Infrastructure-related companies gained from ongoing U.S. government funding, with Vulcan Materials and Martin Marietta seeing benefits from the Infrastructure Investment and Jobs Act. However, they noted input-cost pressures and project permitting delays as risks to margins. In the industrial equipment segment, Deere and Caterpillar showcased robust backlog growth and demand driven by domestic construction and data center investments; however, both faced challenges from rising raw material costs and tariffs that impacted international sales. In logistics, FedEx issued cautious Q2 guidance, citing subdued global freight volumes and high wage expenses, while rail operators experienced flat volume trends with pricing gains offset by inflation in fuel and labor costs. Overall, the sector achieved moderate gains, primarily driven by defense and infrastructure, yet faced margin pressures from rising costs and trade uncertainties.
Figure 7: Volatility measures for the Industrials sector are showing signs of peaking.
Information Technology: The composite model is neutral. Measures of short-term relative price momentum and overbought conditions have recently turned negative, along with a lower short interest ratio and earnings breadth. Longer-term measures of overbought/oversold, sales growth, and inflation expectations remain supportive. We are near the benchmark weight.
Commentary: In June, the S&P 500 Information Technology sector surged 9.7%, leading all sectors for the month. This growth was primarily driven by strong performances in semiconductors, cloud infrastructure, and large-cap software, as investors returned to high-growth stocks amid easing inflation and improved macroeconomic clarity. Nvidia and Broadcom were standout performers; Nvidia’s stock climbed after an upward revision to its data center revenue outlook, while Broadcom rose following better-than-expected Q2 earnings and an increased full-year forecast. Apple and Microsoft also bolstered the sector, benefiting from narratives surrounding AI integration and growing enterprise services revenue. Additionally, enterprise software stocks, such as Oracle, gained momentum due to robust cloud bookings and positive forward guidance. Demand for IT services and cybersecurity remained stable, underpinned by resilient corporate spending and a steady labor market. Investor sentiment strengthened as Federal Reserve officials suggested that no imminent rate hikes were anticipated and eased trade tensions with China. Overall, June’s tech rally reflected renewed confidence in AI monetization, strong fundamentals, and global demand for advanced computing solutions.
Figure 8: Lower inflation expectations (smoothed 21-day point change) remain subdued but have recently increased slightly. A rise above the 1.5 SD line (blue line) would be concerning.
Materials: The composite model remains positive. Measures of short-term trend, volatility, emerging market momentum, commodity strength, and valuations are supportive. We are now modestly overweight the sector (2.8% vs. the benchmark weight of 1.9%).
Commentary: The S&P 500 Materials sector rose 2.1% in June, driven by increasing industrial metal prices, ongoing infrastructure investments, and a recovery in certain chemical and construction material stocks. A notable decline in the U.S. dollar, down 11% from February’s peak, also benefited commodity-linked companies. Copper prices surged over 3%, positively impacting firms like Freeport-McMoran, while stable gold prices supported diversified miners. Construction materials companies, including Vulcan Materials and Martin Marietta, experienced modest gains due to steady demand from federally funded infrastructure projects under the IIJA, though they faced higher input and labor costs. Specialty chemical firms, such as Linde and Air Products, maintained steady performances despite lingering concerns about global manufacturing softness. Internationally, risks persisted with China’s manufacturing PMI remaining in contraction territory and Australian trade data indicating weakening bulk commodity exports, which tempered the outlook for global materials demand. Overall, the sector benefited from favorable commodity prices and U.S. infrastructure momentum, countered by global demand concerns and persistent cost inflation.
Figure 9: Better equity performance in Emerging Markets has historically been positive for the Materials sector.
Real Estate: After underperforming in June, the composite model improved as oversold conditions intensified, breadth improved, bond yields declined, employment data held up, and economic activity has shown signs of stabilizing, albeit at below trend levels. Headwinds include weakness in the homebuilding industry and industrial production statistics for construction supplies. We are neutral with a 2.7% allocation.
Commentary: The S&P 500 Real Estate sector declined by 0.49%, underperforming all major sectors except Consumer Staples. This downturn was primarily driven by persistent sensitivity to elevated long-term interest rates, which increased Treasury yields, putting pressure on real estate valuations and raising capital costs for REITs, particularly in the office, mortgage, and specialty subsectors. Office REITs faced challenges due to weak leasing activity and high vacancy rates in urban areas, while sublease volumes remained elevated, and rent concessions hindered revenue growth. Mortgage REITs experienced book value compression due to spread volatility and limited refinancing opportunities. Although industrial and residential REITs provided some stability, residential landlords reported steady occupancy and modest rent increases—this support was insufficient to counter broader sector weaknesses. Earnings pre-announcements were scarce, but cautious outlooks for funds from operations (FFO) growth emerged for the latter half of the year. Analysts noted that high financing costs and rate policy uncertainty continue to impact capital deployment decisions across the sector. Overall, June’s decline reflected rate pressures and ongoing structural challenges in demand.
Figure 10: An improving Citi U.S. Economic Surprise Index is constructive for real estate. Nonetheless, rates and oversupply are still an issue.
Utilities: The composite model continues to recommend an underweight allocation. Indicators calling trends, OBOS conditions, deviation from trend, earnings yield relative to the S&P 500, manufacturing trends, and capacity utilization are negative. One bright spot is that crude prices have reversed a bit lower. We are underweight.
Commentary: The S&P 500 Utilities sector rose 0.1%, underperforming the broader market as investors gravitated toward higher-growth sectors. The muted performance highlighted the sector’s sensitivity to interest rates, defensive nature, and uncertain earnings outlook. Early-month increases in long-term yields pressured valuations, but Treasury rates stabilized in the last week, allowing for a modest recovery in utility stocks. Although the sector boasts high dividend yields, competition from money market funds and investment-grade bonds, which offer attractive short-duration yields, has dampened demand. Regionally, electricity demand strengthened due to warmer-than-average temperatures, while natural gas distribution volumes stayed stable. Utilities linked to data center power infrastructure, such as NextEra Energy and Dominion, benefited from increased AI-driven energy demand, which enhanced their near-term revenue forecasts. While capital investment in grid modernization and renewables acted as a tailwind, management expressed caution regarding project timelines and rising funding costs. Analysts anticipate modest earnings growth, projecting flat to low single-digit year-over-year EPS gains in Q2. Overall, Utilities posted a slight gain in June, supported by stable operations and infrastructure demand but constrained by rising costs and a shift toward riskier assets.
Figure 11: The Utilities sector dividend is near historically low levels.
Catastrophic Stop Update
The Catastrophic Stop model combines time-tested, objective indicators designed to identify high-risk periods for the equity market. The model entered July recommending a fully invested equity allocation relative to the benchmark.
The Day Hagan Catastrophic Stop model level is 77.27%. The model indicates that investors should maintain their benchmark equity exposure.
Measures evaluating recent breadth thrusts, oversold mean reversion probabilities, investor sentiment, longer-term trends, volume-adjusted supply versus demand, relative stock versus bond trends, credit spreads, and economic activity are supportive. We note that several indicators are positioned to shift to sell signals should upside momentum start to fade.
The weight of the evidence suggests that the recent decline is not expected to extend into a significant downtrend. Of course, if our model flips negative (below 40% for two consecutive days), signaling more substantial problems, we will raise cash immediately.
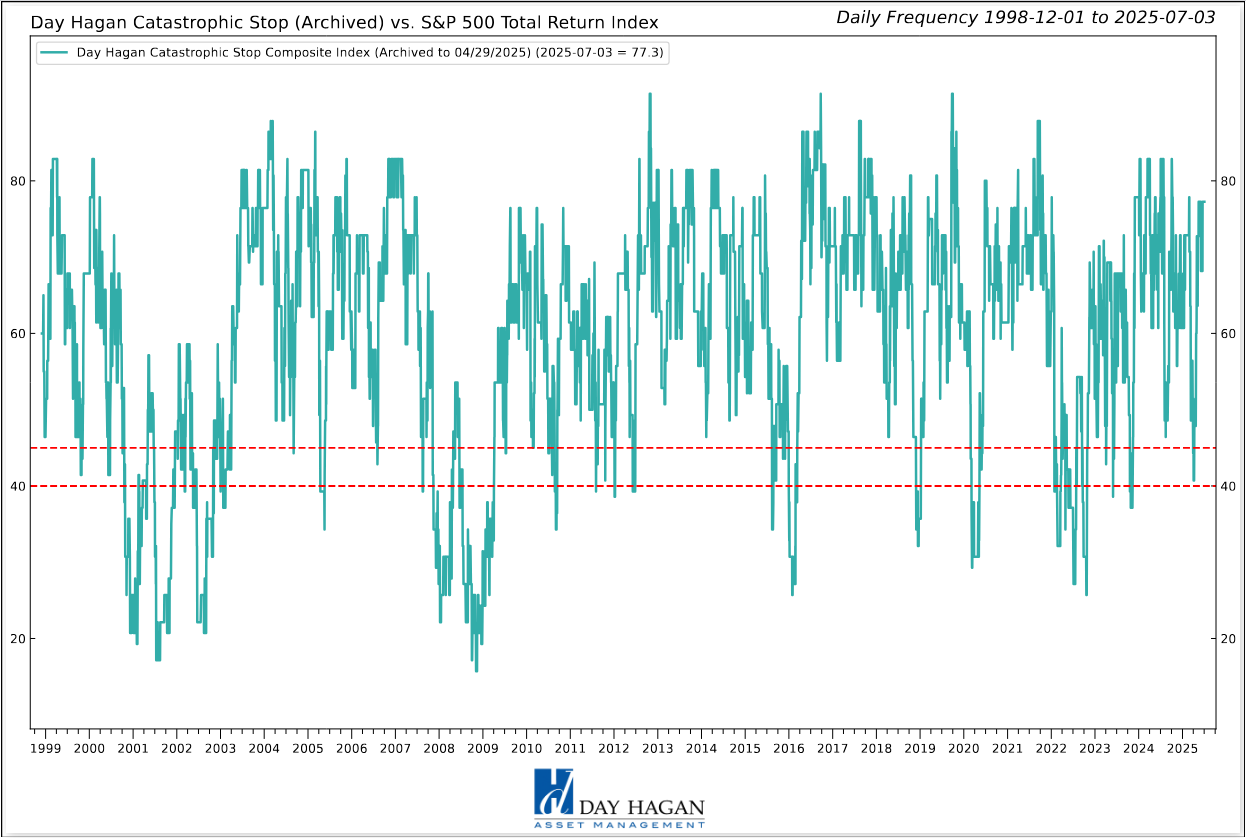
Figure 12: The Catastrophic Stop model recommends a fully invested equity position (relative to the benchmark). Note: Due to the use of indices to extend model history, the model is considered hypothetical.
The Day Hagan Daily Market Sentiment Composite has moved further into the excessive optimism zone. This is not unusual after significant declines; historically, the model has often shown extreme pessimism that quickly transitions into excessive optimism. We interpret this rapid movement similarly to a “breadth thrust.” With sentiment indicators, we go with the flow until it reaches an extreme and reverses. In other words, we will rate this indicator as neutral until it reverses back below 70.
Figure 13: S&P 500 Index vs. Day Hagan Daily Market Sentiment Composite
Our goal is to stay on the right side of the prevailing trend, introducing risk management when conditions deteriorate. Currently, the uptrend remains intact. The broader-based composite models calling U.S. economic growth, international economic growth, inflation trends, liquidity, and equity demand remain constructive. The Catastrophic Stop model is positive, and we are aligned with the message. If our models shift to bearish levels, we will raise cash.
This strategy utilizes measures of price, valuation, economic trends, monetary liquidity, and market sentiment to make objective, rational, and unemotional decisions about how much capital to allocate and where to invest that capital.
For more information, please contact us at:
Day Hagan Asset Management
1000 S. Tamiami Trl
Sarasota, FL 34236
Toll Free: (800) 594-7930
Office Phone: (941) 330-1702
Website: https://dayhagan.com or https://dhfunds.com
This material is for educational purposes only. Further distribution is prohibited without prior permission. Please see the information on Disclosures and Fact Sheets here: https://dhfunds.com/literature. Charts with models and return information use indices for performance testing to extend the model histories, and they should be considered hypothetical. All Rights Reserved. (© Copyright 2025 Day Hagan Asset Management.)
Day HaganSmart Sector®
With Catastrophic Stop ETF
Symbol: SSUS
Disclosures
The data and analysis contained within are provided "as is" and without warranty of any kind, either express or implied. The information is based on data believed to be reliable, but it is not guaranteed. Day Hagan DISCLAIMS ANY AND ALL EXPRESS OR IMPLIED WARRANTIES, INCLUDING, BUT NOT LIMITED TO, ANY WARRANTIES OF MERCHANTABILITY, SUITABILITY, OR FITNESS FOR A PARTICULAR PURPOSE OR USE. All performance measures do not reflect tax consequences, execution, commissions, and other trading costs, and as such, investors should consult their tax advisors before making investment decisions, as well as realize that the past performance and results of the model are not a guarantee of future results. The Smart Sector® Strategy is not intended to be the primary basis for investment decisions and the usage of the model does not address the suitability of any particular in Fixed Income vestment for any particular investor.
Using any graph, chart, formula, model, or other device to assist in deciding which securities to trade or when to trade them presents many difficulties and their effectiveness has significant limitations, including that prior patterns may not repeat themselves continuously or on any particular occasion. In addition, market participants using such devices can impact the market in a way that changes the effectiveness of such devices. Day Hagan believes no individual graph, chart, formula, model, or other device should be used as the sole basis for any investment decision and suggests that all market participants consider differing viewpoints and use a weight-of-the-evidence approach that fits their investment needs.
Past performance does not guarantee future results. No current or prospective client should assume future performance of any specific investment or strategy will be profitable or equal to past performance levels. All investment strategies have the potential for profit or loss. Changes in investment strategies, contributions or withdrawals and economic conditions may materially alter the performance of your portfolio. Different types of investments involve varying degrees of risk, and there can be no assurance that any specific investment or strategy will be suitable or profitable for a client’s portfolio. Historical performance results for investment indexes and/or categories generally do not reflect the deduction of transaction and/or custodial charges or the deduction of an investment management fee, the incurrence of which would have the effect of decreasing historical performance results. There can be no assurances that a portfolio will match or outperform any particular benchmark.
Day Hagan Asset Management is registered as an investment adviser with the United States Securities and Exchange Commission. SEC registration does not constitute an endorsement of the firm by the Commission nor does it indicate that the adviser has attained a particular level of skill or ability.
There may be a potential tax implication with a rebalancing strategy. Re-balancing involves selling some positions and buying others, and this activity results in realized gains and losses for the positions that are sold. The performance calculations do not reflect the impact that paying taxes would have, and for taxable accounts, any taxable gains would reduce the performance on an after-tax basis. This reduction could be material to the overall performance of an actual trading account. Day Hagan does not provide legal, tax or accounting advice. Please consult your tax advisor in connection with this material, before implementing such a strategy, and prior to any withdrawals that you make from your portfolio.
There is no guarantee that any investment strategy will achieve its objectives, generate dividends or avoid losses.
© 2025 Day Hagan Asset Management
