
Day Hagan Smart Sector® with Catastrophic Stop Strategy Update December 2025
A downloadable PDF copy of the Article:
Day Hagan Smart Sector® with Catastrophic Stop Strategy Update December 2025 (pdf)
Executive Summary
As of December 1, 2025, the U.S. economic outlook remains cautiously optimistic, with a "soft landing" viewed as the most probable scenario. The economy is demonstrating resilience despite headwinds like higher tariffs and a record-long government shutdown in the fall, which slightly dampened Q4 growth estimates.
Economic Growth: The consensus forecast points to moderating, but still positive, GDP growth of around 2% in 2025 and 2026, slightly above potential. This growth is primarily supported by substantial AI-related business investment and fiscal stimulus. However, consumer spending growth is expected to slow due to cautious sentiment and the pass-through of higher goods prices from recent tariffs.
Inflation Outlook: Inflation continues to be the primary concern. While headline inflation has moderated significantly from its peak, it has stabilized around 3%, remaining persistently above the Federal Reserve's 2% long-term target. The "last mile" of disinflation is proving challenging, with core inflation measures remaining sticky.
Federal Reserve Policy: The persistent, elevated inflation, coupled with a moderately cooling labor market (unemployment expected to inch up to 4.5% by year-end), has led the market to anticipate a 25-basis-point interest rate cut at the December 2025 FOMC meeting, with an 87% probability priced in by markets. This anticipated easing is a key factor supporting the current economic optimism.
The path ahead remains narrow, balancing growth with price stability.
Sector Dynamics & Drivers:
The U.S. equity market experienced significant volatility and shifting dynamics in November, ultimately ending the month with modest gains for the S&P 500 (+0.25%, total return) and the Dow Jones Industrial Average (+0.32%, total return), while small-cap indices performed better. A push-and-pull between resilient corporate earnings and ongoing macroeconomic and geopolitical uncertainties characterized the month.
Key Factors and Influences:
Corporate Earnings Resilience: The primary support for the market came from robust Q3 2025 corporate earnings reports, the bulk of which were released in early November. The S&P 500's blended earnings growth rate tracked above 13%, surpassing expectations. This strength, particularly in the Technology and Healthcare sectors, underscored the resilience of large-cap companies. However, investor reactions were discerning; while beats were rewarded, even slight misses or cautious forward guidance, such as Meta's warning about AI costs, were met with sharp stock price declines, indicating a flight to quality and high expectations.
Federal Reserve Policy Expectations: Market sentiment was heavily influenced by the anticipation of a Federal Reserve interest rate cut in December. This expectation, fueled by signs of a cooling labor market and easing inflation, led to lower Treasury yields towards the end of the month, benefiting interest-rate-sensitive sectors like Utilities and Real Estate.
AI-Driven Concentration & Tech Pullback: The market rally remained highly concentrated in mega-cap technology stocks tied to the AI buildout. While enthusiasm for AI fueled the market for much of the year, the technology sector experienced a significant mid-month pullback of 4.3% in November as investors took profits and reassessed high valuations. This rotation of capital into more defensive sectors, such as Healthcare and Consumer Staples, created sector divergence.
Geopolitical and International Factors: Geopolitical risks, including speculation around Russia-Ukraine peace talks that softened oil prices, and ongoing US-China trade tensions, contributed to intra-month volatility. The strengthening US dollar also affected international returns, though emerging markets continued to perform well, aided by signs of easing inflation abroad.
Overall, the U.S. equity market navigated a complex landscape in November, ultimately maintaining its upward trajectory despite the rotation and volatility.Holdings
Sector
Consumer Discretionary
Consumer Staples
Communication Services
Energy
Financials
Health Care
Industrials
Information Technology
Materials
Real Estate
Utilities
Outlook (relative to benchmark weighting)
Underweight
Overweight
Overweight
Underweight
Underweight
Overweight
Underweight
Overweight
Overweight
Neutral
Neutral
Sector Review
Our December sector tilts suggest a moderately defensive stance with selective growth exposure, consistent with expectations for slowing but positive economic growth, disinflationary trends, and elevated but stable interest rates.
Overweights in IT and Communication Services imply confidence in productivity-driven growth, AI adoption, and margin resilience. These sectors typically outperform when rates stabilize, and earnings leadership narrows. Health Care and Consumer Staples overweights signal a defensive lean—these sectors provide non-cyclical demand and stable cash flows, often favored when recession risks rise. Materials OW suggests that manufacturing activity or infrastructure spending (e.g., the U.S. CHIPS Act, green transition investments) may remain supportive.
Neutral allocations to Real Estate and Utilities reflect a balanced view: higher-for-longer rates pressure REITs and capital-intensive utilities, yet both may offer income stability that has potential to become more attractive if economic uncertainty grows.
Underweights in Financials, Consumer Discretionary, Industrials, and Energy indicate caution toward cyclical and rate-sensitive areas. Pressure on bank margins, softening consumer demand, slowing capital expenditure, and range-bound commodity prices typically align with expectations for below-trend GDP growth and easing inflation rather than a strong reacceleration.
Overall, these allocations suggest a worldview where earnings durability and structural growth are favored over economically sensitive sectors as the U.S. moves toward a late-cycle or mild-slowdown environment.
Consumer Discretionary: The indicators present a predominantly bearish outlook for the S&P 500 Consumer Discretionary sector. The immediate technical picture is negative, with both the short- and intermediate-term moving averages crossing bearishly. This weakness is reinforced by negative relative price momentum and an overbought/oversold indicator, suggesting a prevailing downward trend. Fundamentally, the sector trades at a bearish relative forward P/E, and total consumer credit levels appear to be a headwind, indicating potential pressure on future consumer spending power. Conversely, a few select indicators offer bullish counterpoints, suggesting potential long-term resilience or external support factors. The bullish 120-Day Net New Highs implies underlying strength in specific components or a potential base forming. Furthermore, positive housing starts data and downward pressure on the 30-Year Treasury Yield are traditionally supportive of discretionary spending and sector valuations. The neutral price deviation from trend and discretionary consumer spending metrics suggest that while momentum is negative, the current position is not yet in extreme oversold territory, warranting careful monitoring for a potential reversal signal.
Commentary: The Consumer Discretionary sector underperformed the broader S&P 500 index in November. This underperformance was primarily due to investor concerns about cautious consumers and an uncertain economic environment. Worries about inflation affected future spending, despite strong jobs reports earlier in the year. However, the sector received a boost at the end of the month from positive retail reports. These reports, which surrounded the Thanksgiving holiday weekend and Black Friday sales data, eased some fears. American Eagle Outfitters (AEO) stock increased after the company reported strong Q3 earnings and a record-breaking holiday start. Future Outlook: This sector is highly sensitive to consumer confidence, employment data, and overall economic health. Monitoring holiday sales data through December will be very important. Investors should watch how changes in household purchasing power, driven by tariffs or tax policy changes, affect consumer spending on non-essential goods and services as we move into the new year.
Figure 1: Consumer Discretionary relative price momentum is declining.
Consumer Staples: Positive momentum is evident in several metrics, including robust relative price momentum, an oversold condition that favors upside potential, strong net new highs, positive 45-day relative breadth, and a high relative short interest ratio. Favorable external economic factors supporting this defensive sector include benign financial conditions as indicated by the Chicago Fed National Financial Conditions Index, solid year-over-year food sales growth, and a positive sector sales yield. The Citi G10 Economic Surprise Index is also a tailwind. The primary cautionary signals are technical and inflation-oriented. The relative strength moving average cross is currently bearish, indicating that the recent strong performance has yet to translate into a decisive long-term uptrend signal fully. Additionally, a bearish reading on food CPI year-over-year inflation suggests margin pressures could become a headwind, although current sales yields remain supportive. The negative price deviation from trend further emphasizes that while momentum is positive, an apparent trend change signal has not been confirmed across all indicators, suggesting a need for balanced caution despite the overall bullish bias.
Commentary: The Consumer Staples sector showed stability and modest gains. It outperformed the S&P 500 during periods of high volatility and during the sharp technology-sector rotation in November. As a defensive sector, it attracted investors seeking stability, reliable dividends, and a hedge from market swings. Companies in this sector sell essential goods that consumers buy regardless of economic conditions. This makes their earnings predictable and less volatile for capital when growth stocks struggle. Future Outlook: This sector is a classic defensive play. Its performance is primarily tied to consumer demand for necessities. Monitoring inflation levels is crucial, as rising costs can compress profit margins. Investors should watch for shifts in consumer preferences toward private labels during economic slowdowns. Supply chain efficiency is also important for managing operating expenses in a challenging environment.
Figure 2: Better economic news is negative for defensive stocks. The ESI is currently positive, acting as a headwind for Staples.
Communication Services: The S&P 500 Communication Services sector exhibits a clearly bullish profile across all available indicators. The technical momentum is robust. The sector's relative price moving average cross is bullish, confirming a sustained uptrend. This strength is further reinforced by strong readings in two separate relative price overbought/oversold metrics and a positive deviation from its trend, indicating strong technical support and positive investor sentiment. Fundamentally, external economic conditions appear favorable for continued outperformance. A steepening yield curve, as reflected in the bullish 10-year minus 2-year Treasury yield spread, typically favors growth sectors like communication services. Furthermore, a bullish relative earnings yield suggests that, despite strong performance, the sector still offers an attractive risk/reward profile relative to the broader market. The confluence of these technical and macroeconomic factors indicates a high probability of continued positive relative performance for the sector.
Commentary: The Communication Services sector showed mixed, but ultimately positive, results in November. Large companies like Alphabet saw considerable gains, offsetting declines in the traditional media and telecom sectors. Alphabet's stock increased by over 6% after the announcement of its new Gemini 3 AI model. This announcement improved investor confidence in the company's ability to compete in the AI field. The sector's overall performance was tied to its most prominent companies and to the broader tech market's mid-month decline. This decline briefly slowed momentum in digital advertising stocks. Future Outlook: This sector is heavily influenced by advertising spending, consumer demand for digital entertainment services, and potential regulations regarding content moderation and market dominance. It's essential to monitor the ongoing AI competition among major tech companies. It's also critical to see how new product innovations translate into financial gains and user engagement. The sector's future depends on monetization strategies for AI and entertainment intellectual property.
Figure 3: The Communication Services sector is reversing from short-term oversold conditions.
Energy: The overall sector relative strength indicator is bearish, along with the moving average crossover and negative free cash flow yield momentum, signaling a lack of technical conviction and fundamental pressure points. The sector also faces headwinds from current crude oil supply and spot prices, both of which are bearish. However, several bullish signals suggest an upturn is possible. The sector is currently positioned as oversold, which historically favors a bounce. Favorable volatility metrics, positive 150-day sector breadth, and a bullish reading on the total world rig count provide support. Furthermore, crude oil price dynamics, including its relationship with the 5-month SMA and Bollinger Bands, indicate underlying support despite recent spot price pressure. The U.S. Dollar Trade Weighted Index reading is neutral, removing a potential currency headwind. This data suggests a balanced risk profile, with short-term technical weakness contrasted by potential value and supportive industry fundamentals.
Commentary: Energy stocks were strong participants in the broader market rotation, posting gains in November as capital flowed into value-oriented segments. This occurred despite WTI crude oil prices declining during the month. The softening in commodity prices, typically a negative indicator for the sector, was primarily driven by speculation around successful Russia-Ukraine peace talks and easing geopolitical supply risks. The sector's resilience suggests investors focused more on valuation and strong Q3 cash flows than on daily spot prices. Future Outlook: Energy sector performance is highly correlated with global commodity prices (oil and gas), geopolitical stability, and OPEC+ production decisions. Watch global growth trends, especially demand from China and India, as a slowdown could depress prices. Potential Federal Reserve rate cuts could weaken the U.S. dollar, which historically benefits commodity prices. Ongoing geopolitical developments will continue to dictate short-term volatility.
Figure 4: Crude oil inventories starting to normalize.
Financials: Technical indicators across relative price trend, momentum, overbought/oversold metrics, total return trend, volatility, and maximum relative drawdown are all uniformly bearish. This suggests consistent underperformance relative to the broader market, indicating a lack of current investor appetite for the sector and ongoing price pressure. The strong U.S. Dollar is also a headwind. However, several fundamental indicators provide a robust bullish case. Positive economic surprises in the G10 suggest a supportive macroeconomic backdrop. Favorable business credit conditions, solid bank loan growth, an attractive forward earnings yield, and a steepening yield curve all point to improving operational environments for financial institutions. The divergence between weak technical sentiment and strong fundamental support indicates potential value in the sector, suggesting that while short-term price action is negative, the underlying economic engine for financials is strengthening.
Commentary: The Financials sector performed well in November, benefiting from expectations of a Federal Reserve interest rate cut in December 2025, which would ultimately improve the lending environment and potentially boost M&A and IPO activity across capital markets. Strong Q3 earnings reports across many firms, notably Goldman Sachs and JPMorgan, solidified investor confidence in the sector’s stability and operational efficiency. The improved economic outlook, pointing to a potential "soft landing" rather than a recession, fostered a risk-on sentiment that helped regional banks and other diversified financial institutions recover ground lost earlier in the year. Future Outlook: Financials are highly sensitive to interest rates, the shape of the yield curve (steep vs. flat), and broader economic growth metrics such as GDP and employment rates. Watch the trajectory of Fed policy very closely; a sudden shift in expected rate cuts could rapidly reverse sentiment. Monitor commercial real estate loan exposure levels, which remain a key vulnerability for many regional banks, as well as the pace of digital transformation in banking services.
Figure 5: Keeping an eye on credit spreads in the Financials sector. Up slightly, but so far, the increase isn’t indicating a major problem in the financial market structure.
Healthcare: The majority of indicators point to continued relative strength against the broader market. Technical readings are highly favorable, including positive relative price trends, strong relative strength momentum, positive 100-day relative breadth, and a bullish sector trend indicator. This suggests robust investor interest and positive price action. However, several caution flags exist that warrant attention. A bearish signal regarding the sector's maximum relative drawdown indicates susceptibility to sharp, though potentially short-lived, pullbacks. Fundamental pressures also present headwinds: bearish indicators in healthcare personal expenditure and sector book yield suggest potential future operational challenges or valuation concerns. A neutral reading on both momentum reversals and new construction indicates a balanced immediate trajectory. Overall, the data implies the sector is in a strong technical uptrend, but investors should monitor fundamental metrics for potential divergence in the medium term.
Commentary: Health Care was a standout performer in November, surging to reach new all-time highs and posting its best monthly performance in three years. This robust performance was driven by a decisive rotation of capital from underperforming mega-cap technology stocks into more defensive, quality-oriented sectors with strong balance sheets. Investor sentiment improved significantly due to strong underlying fundamentals, consistent demand for medical services across economic cycles, and a "bullish cross" in long-term momentum indicators, signaling a potential shift in trend. Specific biotech firms saw gains following positive clinical trial results. Future Outlook: This sector is sensitive to healthcare policy changes and ongoing drug pricing debates at the federal and state levels, which introduce regulatory risk. However, it benefits from an aging global population (demographic tailwinds) and ongoing innovation in health technology and biotechnology research. Watch for a flurry of M&A activity as larger pharmaceutical companies seek to acquire innovative smaller biotechs, and breakthroughs in personalized medicine that could redefine the market.
Figure 6: Health Care sector showing signs of improved pricing power.
Industrials: The S&P 500 Industrials sector presents a mixed quantitative picture, balancing several positive technical and macroeconomic indicators with a few key bearish signals. The overall trend remains cautiously bullish. Strong relative price momentum, a positive price trend, bullish RSI readings, and positive industrial production data provide a solid foundation for continued relative strength. The sector also benefits from a high cash flow yield, a strong U.S. dollar, and favorable trends in the CRB Index. However, several metrics suggest potential headwinds. A conflicting relative price momentum indicator is bearish, as are high sector volatility and an increase in 210-day new lows, which point to underlying weakness in some components. A low sales yield and negative pressure from oil futures introduce fundamental concerns regarding margins and input costs. The neutral consumer confidence reading offers no strong directional bias. This data suggests a selective approach is warranted, as specific pockets of weakness and operational pressures challenge the broader sector's strength.
Commentary: The Industrials sector underperformed the S&P 500 in November. It traded lower amid a mid-month tech-led market pullback. Investors were generally cautious regarding global growth prospects. Job losses in the construction and manufacturing sectors, as indicated by the ADP report, decreased enthusiasm for cyclical stocks. Hopes for easing international trade tensions and potential new domestic infrastructure initiatives provided support. This support helped prevent a deeper decline in the sector index. Future Outlook: The Industrials sector benefits from increased business confidence, government-mandated building and defense projects, and overall global economic growth. Government spending on infrastructure, the resilience of global supply chains, and evolving international trade policies, particularly with China and Europe, are worth monitoring. The sector is cyclical, meaning its performance often reflects broader economic trends.
Figure 7: The Industrials sector momentum is showing signs of reversing from lows.
Information Technology: From a quantitative perspective, the S&P 500 Information Technology sector exhibits a mixed but predominantly bullish profile. Strong technical momentum and favorable fundamental indicators underpin a positive outlook. The sector maintains strong relative price momentum, indicating ongoing investor demand. This is supported by robust earnings revision breadth and an attractive sales yield, both of which suggest healthy operational performance. Furthermore, rising market-based inflation expectations are typically a positive signal for sectors with pricing power. Cautionary signals indicate a highly dynamic environment and some potential for short-term consolidation. Conflicting overbought/oversold readings suggest the sector may be due for a pause, balancing substantial recent gains with potential for profit-taking. Additionally, a bearish reading of the relative short interest ratio suggests short sellers are increasing their positions, which might signal a lack of universal confidence or a tactical bet on a near-term pullback. The data suggests an overall constructive long-term view, but the potential for heightened volatility remains high.
Commentary: The Information Technology sector experienced a significant shift in November, declining as investors engaged in profit-taking and reassessed high valuations for AI-related infrastructure after an extended rally. The month was marked by intense scrutiny of AI spending and by unwinding momentum, amplified by technical factors as key indices crossed below their 50-day moving averages. Despite the pullback, the long-term fundamentals for AI adoption remain strong, which helped the sector rebound sharply towards the month-end after the White House announced the "Launching the Genesis Mission" initiative to accelerate scientific discovery through AI. Future Outlook: The sector is susceptible to interest rates, with higher rates putting pressure on valuations, particularly for high-growth tech firms that rely heavily on future earnings. Watch for increased regulatory scrutiny of data privacy and antitrust grounds, as well as the ability of tech giants to monetize their massive AI investments effectively. The sector’s performance is tightly linked to global economic sentiment and corporate spending budgets on digital transformation initiatives.
Figure 8: The Information Technology sector earnings revision breadth is positive.
Materials: The Materials sector presents a generally bullish quantitative profile, supported by strong fundamental and macroeconomic factors. Positive indicators include strong relative price momentum, an oversold condition suggesting upside potential, favorable sector volatility, positive momentum in emerging/developed equities, and positive momentum in silver and gold futures. The sector's fundamentals are supported by strong earnings and sales yields, along with robust U.S. industrial production data, all of which point to a constructive environment for the sector's performance relative to the broader market. Conversely, several technical and commodity-specific indicators register caution. The relative price moving average cross is bearish, as is the deviation trend indicator, suggesting the recent positive momentum has yet to establish a firm, long-term uptrend. Bearish signals from copper spot momentum and natural gas futures mean reversion indicate potential pressure on input costs or specific commodity-driven segments within the sector. The overall picture is positive, but the data highlights a dynamic environment where fundamental strength balances against some technical caution flags.
Commentary: Investors shifted capital toward cyclical areas, anticipating a stable economic outlook for 2026. This sector often benefits from "risk-on" sentiment and the potential for increased business investment and new building projects globally. Positive global growth sentiment and anticipation of improved economic conditions provided support. This support outweighed mid-month volatility tied to trade concerns. Future Outlook: Performance is tied to global commodity prices, industrial demand, and global economic growth. Monitoring trade policies, especially concerning tariffs, which can impact material costs and supply chains, is vital. Investors should also pay attention to China's economic recovery trends. The ongoing transition toward a green economy is also increasing demand for specific materials.
Figure 9: The Materials sector relative earnings yield is showing signs of improvement.
Real Estate: The majority of technical indicators signal ongoing relative weakness against the broader market. The relative price trend is bearish, as are metrics for percentage positive days and price deviation from trend, indicating persistent downward pressure and a lack of investor confidence. Furthermore, external fundamental headwinds include a bearish 30-Year Treasury Yield environment, negative industrial production data for construction supplies, and tight small-business credit conditions. Several counter-indicators suggest underlying strength and potential for tactical opportunities. Positive relative breadth and firm performance in the homebuilding sub-industry provide bullish technical support. Favorable unemployment data and a positive Citi Economic Surprise Index offer constructive macroeconomic tailwinds. This divergence between weak current price action and some improving underlying fundamentals suggests the sector is at a potential inflection point. The data support a cautious approach, with close monitoring of interest rate dynamics and employment data for a sustained reversal signal.
Commentary: Real Estate Investment Trusts (REITs) saw positive momentum in November. This was due to the decline in Treasury yields and the increased probability of a December rate cut by the Federal Reserve. Lower yields reduce the discount rate, making high-dividend REITs more attractive. The sector is seen as an inflation hedge with stable, long-term lease agreements. It offers potential growth and income generation, which appeals to a cautious market. Future Outlook: This sector is sensitive to interest rate fluctuations. Watching the direction of long-term interest rates and the dynamics of specific property sub-markets is crucial. Commercial property market dynamics, especially in urban centers, remain a key area of focus for potential systemic risk or opportunity.
Figure 10: The NFIB Small Business Credit Conditions survey has declined; a headwind for Real Estate.
Utilities: The sector currently presents a mixed quantitative picture, balancing significant technical weakness with strong defensive fundamentals and macroeconomic support. Many technical indicators are bearish, including the moving average cross, percentage reversals, price momentum, price deviation from trend, and relative breadth. This indicates a current lack of relative strength and a prevailing downward price trend relative to the broader market. Bullish indicators suggest the sector is near a potential bottom and may offer value. Bullish signals include oversold conditions, a positive dividend yield, and supportive macroeconomic indicators such as favorable crude oil futures dynamics, a bullish copper/gold ratio, and positive PMI manufacturing data. The primary headwind is bearish earnings yield relative to the 10-Year Treasury, suggesting the sector may be slightly rich relative to risk-free alternatives. This data suggests a tactical opportunity for a mean-reversion trade, but a lack of confirmed technical uptrend signals necessitates a cautious approach.
Commentary: The Utilities sector offered a defensive haven during November's market volatility. It attracted investors seeking stable, dividend-paying stocks as interest rates ended the month slightly lower, despite intra-month spikes. The sector’s stability and regulated business models make it attractive when growth sectors face valuation pressures or economic uncertainty increases. Future Outlook: Utilities are sensitive to interest rate changes and regulatory environments. Monitoring Federal Reserve guidance on future rate cuts is important for this sector's valuation. Watch for infrastructure investments in grid modernization and the transition to renewable energy sources, as these represent long-term growth opportunities that require regulatory approval and capital expenditures.
Figure 11: The manufacturing sector is still under pressure. A turnaround would benefit Utilities and AI.
Catastrophic Stop Update
The Catastrophic Stop model combines time-tested, objective indicators designed to identify high-risk periods for the equity market. The model entered December recommending a fully invested equity allocation relative to the benchmark.
The weight of the evidence suggests that any weakness is unlikely to extend into a significant downtrend at this time. Of course, if our model triggers a sell signal (below 40% for two consecutive days), indicating more substantial problems, we will raise cash immediately.
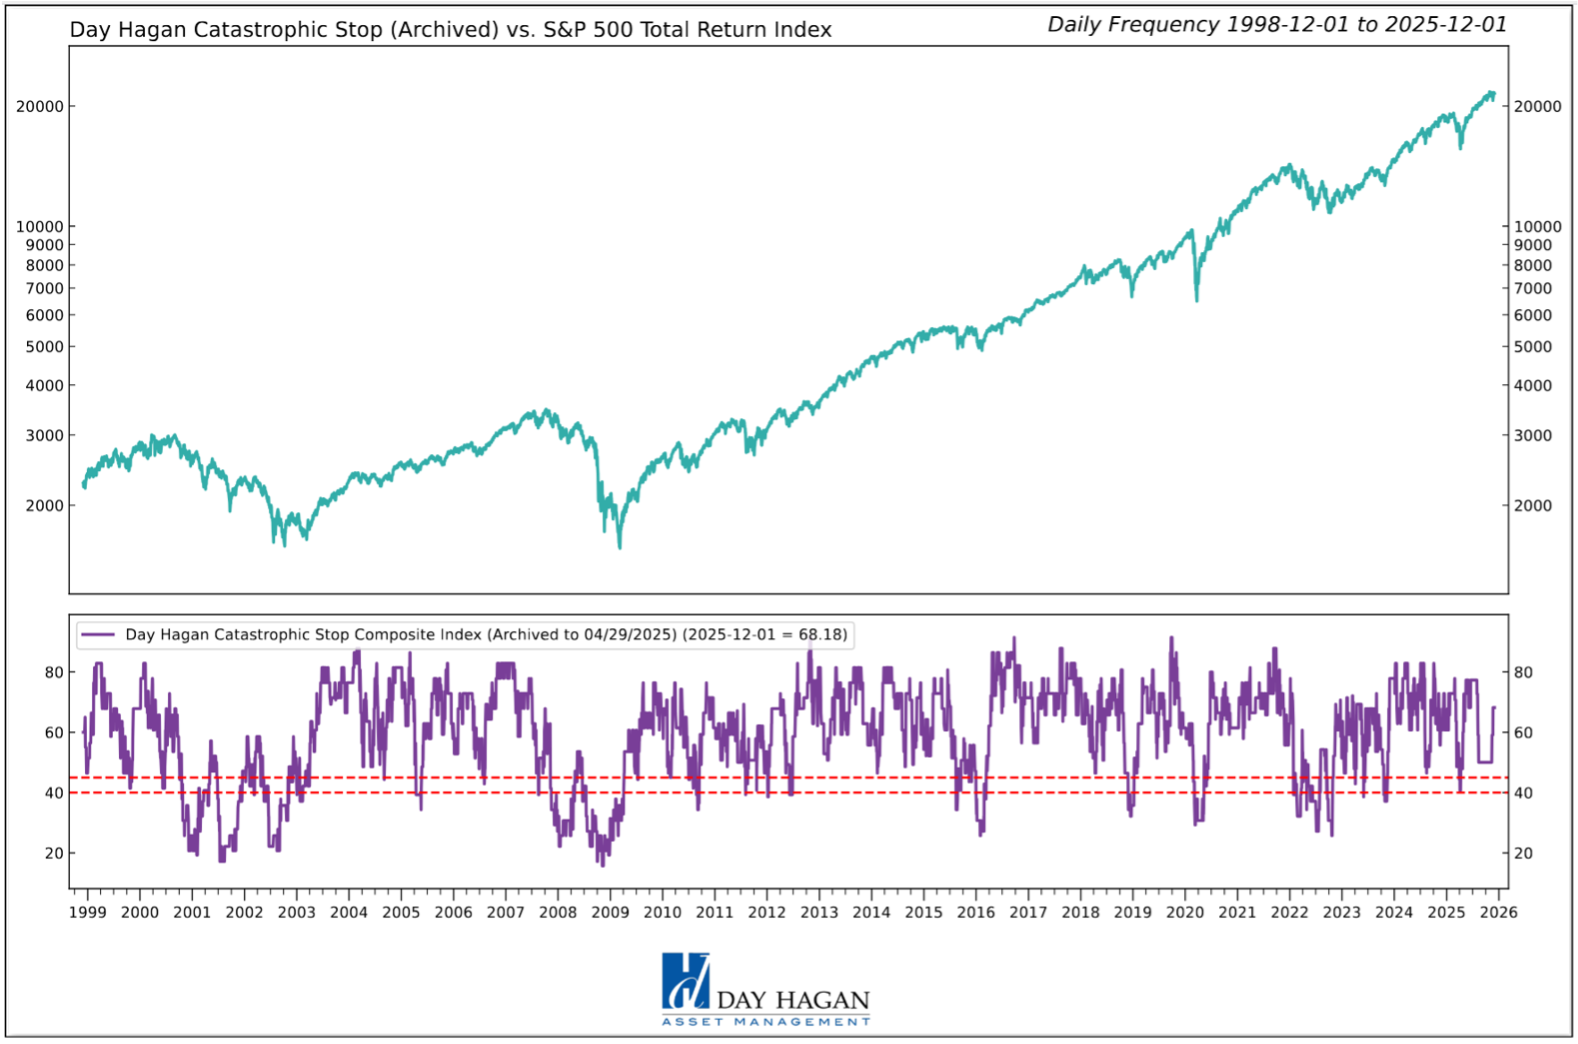
Figure 12: The Catastrophic Stop model recommends a fully invested equity position (relative to the benchmark). Because the model uses indices to extend its history, it is considered hypothetical.
The Day Hagan Daily Market Sentiment Composite (part of the Catastrophic Stop Model) remains in the “Excessive Pessimism” zone, reflecting a notable rise in investor caution. Sentiment remains excessively pessimistic based on our short-term model. This is viewed as a net positive from a contrary opinion perspective.
Figure 13: Investor sentiment is being reset, as illustrated by the DH Daily Market Sentiment Composite declining below 70. A reversal back above 30% would enhance the potential for a rally.
Our goal is to stay on the right side of the prevailing trend, introducing risk management when conditions deteriorate. Currently, the uptrend remains intact. The broader-based composite models, which call for U.S. and international economic growth, inflation trends, liquidity, and equity demand, remain constructive. The Catastrophic Stop model is positive, and we align with its message. If our models shift to bearish levels, we will raise cash.
This strategy uses measures of price, valuation, economic trends, liquidity, and market sentiment to make objective, rational, and unemotional decisions about how much capital to allocate and where to invest it.
Day Hagan Asset Management
1000 S. Tamiami Trl
Sarasota, FL 34236
Toll Free: (800) 594-7930
Office Phone: (941) 330-1702
Website: https://dayhagan.com or https://dhfunds.com
This material is for educational purposes only. Further distribution is prohibited without prior permission. Please see the information on Disclosures and Fact Sheets here: https://dhfunds.com/literature. Charts with models and return information use indices for performance testing to extend the model histories, and they should be considered hypothetical. All Rights Reserved. (© Copyright 2025 Day Hagan Asset Management.)
Day HaganSmart Sector®
With Catastrophic Stop ETF
Symbol: SSUS
Disclosures
The data and analysis contained within are provided “as is” and without warranty of any kind, either express or implied. The information is based on data believed to be reliable, but it is not guaranteed. Day Hagan DISCLAIMS ANY AND ALL EXPRESS OR IMPLIED WARRANTIES, INCLUDING, BUT NOT LIMITED TO, ANY WARRANTIES OF MERCHANTABILITY, SUITABILITY, OR FITNESS FOR A PARTICULAR PURPOSE OR USE. All performance measures do not reflect tax consequences, execution, commissions, and other trading costs, and as such, investors should consult their tax advisors before making investment decisions, as well as realize that the past performance and results of the model are not a guarantee of future results. The Smart Sector® Strategy is not intended to be the primary basis for investment decisions, and the usage of the model does not address the suitability of any particular investment for any particular investor.
Using any graph, chart, formula, model, or other device to assist in deciding which securities to trade or when to trade them presents many difficulties, and their effectiveness has significant limitations, including that prior patterns may not repeat themselves continuously or on any particular occasion. In addition, market participants using such devices can impact the market in a way that changes the effectiveness of such devices. Day Hagan believes no individual graph, chart, formula, model, or other device should be used as the sole basis for any investment decision and suggests that all market participants consider differing viewpoints and use a weight-of-the-evidence approach that fits their investment needs.
Past performance does not guarantee future results. No current or prospective client should assume future performance of any specific investment or strategy will be profitable or equal to past performance levels. All investment strategies have the potential for profit or loss. Changes in investment strategies, contributions or withdrawals, and economic conditions may materially alter the performance of your portfolio. Different types of investments involve varying degrees of risk, and there can be no assurance that any specific investment or strategy will be suitable or profitable for a client’s portfolio. Historical performance results for investment indexes and/or categories generally do not reflect the deduction of transaction and/or custodial charges or the deduction of an investment management fee, the incurrence of which would have the effect of decreasing historical performance results. There can be no assurances that a portfolio will match or outperform any particular benchmark. Comparisons to indices are inherently unreliable indicators of future performance. The strategies used to generate the performance vary from those used to generate the returns depicted in the benchmarks. Investors cannot directly invest in an index.
The information contained herein is provided for informational purposes only and should not be construed as investment advice or a recommendation to buy or sell any security. The securities, instruments, or strategies described may not be suitable for all investors, and their value and income may fluctuate. Past performance is not indicative of future results, and there is no guarantee that any investment strategy will achieve its objectives, generate profits, or avoid losses.
This material is intended to provide general market commentary and should not be relied upon as individualized investment advice. Investors should consult with their financial professional before making any investment decisions based on this information.
Data and analysis are provided “as is” without warranty of any kind, either express or implied. Day Hagan Asset Management, its affiliates, employees, or third-party data providers shall not be liable for any loss sustained by any person relying on this information. All opinions and views expressed are subject to change without notice and may differ from those of other investment professionals within Day Hagan Asset Management or Ashton Thomas Private Wealth, LLC.
Accounts managed by Day Hagan Asset Management or its affiliates may hold positions in the securities discussed and may trade such securities without notice.
Day Hagan Asset Management is a division of and doing business as (DBA) Ashton Thomas Private Wealth, LLC, an SEC-registered investment adviser. Registration with the SEC does not imply a certain level of skill or training.
There is no guarantee that any investment strategy will achieve its objectives, generate dividends, or avoid losses.
This material is for educational purposes only. Further distribution is prohibited without prior permission. Please see the information on Disclosures and Fact Sheets here: https://dhfunds.com/literature. Charts with models and return information use indices for performance testing to extend the model histories, and they should be considered hypothetical. All Rights Reserved. (© Copyright 2025 Day Hagan Asset Management.)
© 2025 Day Hagan Asset Management
