
Day Hagan Smart Sector® with Catastrophic Stop Strategy Update August 2024
A downloadable PDF copy of the Article:
Day Hagan Smart Sector® with Catastrophic Stop Strategy Update August 2024 (pdf)
Catastrophic Stop Update
The Catastrophic Stop model combines time-tested, objective indicators designed to identify high-risk periods for the equity market. The model (Figure 1) held steady during July and entered August with a fully invested equity allocation recommendation.
Figure 1: Catastrophic Stop Model vs. S&P 500 Total Return Index
Breadth has shown improvement (Figure 2), indicating better market participation and possibly the rank-and-file catching up to the leaders. Meanwhile, the Sentiment factor (Figure 3) has declined to the Excessive Pessimism zone with the update on 7-31-2024. This suggests that some of the excesses in the market have been alleviated. A move into the mid-30s would likely offer near-term support, based on the market’s response when it reached those levels in October of last year and April of this year. On both occasions, intermediate-term lows were formed.
Figure 2: ACWI Breadth Factor illustrates better participation.
Figure 3: The NDR Daily Trading Sentiment Composite is now evidencing excessive pessimism.
Figure 4: The percentage of stocks outperforming the S&P 500 YTD is still just 34.6%, even after the small-cap rally in July.
Other technical measures within the Catastrophic Stop models remain generally bullish outside of breadth, with the exception of the Breadth Thrust and Oversold Mean Reversion factors, which are neutral. Overall, the model’s external (operating environment-related) indicators remain positive, though other indicators we track that evaluate the economic landscape are showing signs of fatigue. Nonetheless, measures of financial stress, such as Option Adjusted Spreads (Figure 5), indicate the probability of an extended downturn is, at this juncture, relatively low.
Figure 5: OAS for Corporates, High Yield, Mortgages, and Agencies remain below long-term averages.
Sector Outlook
Sector
Consumer Discretionary
Consumer Staples
Communication Services
Energy
Financials
Health Care
Industrials
Information Technology
Materials
Real Estate
Utilities
Outlook (relative to benchmark weighting)
Neutral
Neutral
Neutral
Neutral
Neutral
Overweight
Neutral
Neutral
Underweight
Underweight
Neutral
Sector Commentary
On July 25, we reduced exposure to the Information Technology sector. The sector model had moderated to a more neutral level, and we removed approximately 4% of combined exposure by booking profits from the portfolio’s XLK (the Technology Select Sector SPDR Fund) and MAGS (Magnificent Seven ETF) positions.
We reinvested the proceeds into the Invesco S&P 500 Equal Weight ETF (ticker: RSP). The change effectively reduced information technology sector exposure to just above the benchmark level while simultaneously increasing sector exposure to smaller and midcap companies within the S&P 500. Entering July, we were heavily invested in the tech sector due to positive internal and external indicators. The number of new highs had increased, and other breadth indicators were close to signaling a buy. We suggested that it might be time for the troops to support the generals. We mentioned last month that the sector was overbought, but sometimes overbought conditions can persist. However, at that point, even though a clear reversal had not happened, a few of our short-term indicators were showing signs of exhaustion. Our model indicated that there was less support for the bullish trend, so being significantly overweight was no longer justified. We noted that the positioning for upside in the MAGS was overextended, as investors were fully committed to those stocks.
With investors excessively optimistic, companies needed strong earnings performance to meet expectations, and it was becoming less certain that the earnings growth would materialize. For a sense of valuation, NVDA was recently trading at 23.3 times forward sales (not earnings), down from 25.3 times on July 1. For comparison, Microsoft was at 13.0 times (compared to 13.6x on July 1) and Apple was at 8.7 times (compared to 8.4x on July 1). We are now neutral on the sector relative to the benchmark (see the specific sector model comments below).
Overall, in July, U.S. equities showed resilience, driven by strong Q1 earnings trends, positive earnings revisions, and retail fund inflows into equities. Despite concerns over inflation, the market held onto gains from the first half of the year. Macro factors like persistent inflation and tempered expectations for Federal Reserve rate cuts created a challenging environment, but positive market breadth was accelerating, with many stocks moving above their 50-day moving average, indicating a bullish market.
The Federal Open Market Committee decided to keep the federal funds rate unchanged at 5.25% to 5.50%, emphasizing the need for greater confidence in inflation reaching its 2% target before reducing the target range. The committee highlighted continued solid economic expansion, moderating job gains, slightly increasing unemployment rate, and somewhat elevated inflation. The Federal Reserve continues to reduce its holdings of U.S. Treasury securities and agency mortgage-backed securities. Speculation about a potential rate cut at the next meeting in September 2024 depends on upcoming employment and inflation data, though most market participants are already pricing in the cut. All in all, economic growth remains positive, and inflationary pressures continue to diminish, providing support for the equity uptrend. If our models shift more negatively, we will quickly respond.
Sector Review
Consumer Discretionary: The overall model continued to improve into the August update, with several technical measures turning positive. Trend and short-term momentum have shifted to bullish readings in tandem with relative price strength reversing from oversold levels. Relative valuations and consumer credit conditions are also providing bullish support. We note that weaker housing starts, a still-elevated interest rate environment, and a lack of upside earnings surprises are headwinds. The net result is a high-neutral composite model level and our resulting neutral allocation. Amazon, Tesla, and Home Depot are the top three holdings, and over the past 90 days, Amazon has had 49 upward revisions and 1 downward revision to its FY1 earnings by analysts. Tesla has had 4 upgrades and 25 downgrades, while Home Depot has 9 upgrades and 22 downgrades. This exemplifies the mixed picture offered by our indicators.
Figure 6: Earnings surprises have turned negative for consumer discretionary stocks, urging caution.
Consumer Staples: The defensive-oriented Staples sector composite model also improved to neutral from bearish, with measures of momentum turning positive, relative strength price trends exiting oversold conditions, and breadth statistics improving. However, credit conditions, decelerating pricing power, and a short-interest overhang are headwinds. When higher beta sectors corrected last month, defensive sectors benefited. At this point, the models are inconclusive as to whether the rotation has legs, i.e., neutral levels don’t currently imply a long-term revival for Staples. Nonetheless, we are increasing exposure in line with the model’s message and will monitor for continued model improvement. The top 5 holdings include Procter & Gamble, PepsiCo, Coca-Cola, Costco, and Walmart. When reviewing PG’s latest earnings report, we note that 8 out of 10 product categories had higher organic sales, with organic sales growing about 2% from the previous quarter. However, earnings declined 5.1% from the previous quarter, and net income declined 7.3%. PG noted volume softness in Europe, Asia Pacific, the Middle East, and African countries as consumers remain price-conscious. The strong U.S. dollar was also a headwind. This is endemic to many other large multinational corporations we cover outside of the tech space.
Figure 7: Economic weakness eventually benefits defensive areas of the market.
Communication Services: The overall model improved slightly but remained at low-neutral levels. From a technical perspective, measures of trend, longer-term overbought/oversold, and relative volatility are negative, alongside negative earnings revisions breadth and elevated valuations. The few positive supports include positive sales growth trends, sector-related bond spreads that are still narrow (indicating positive liquidity), and a less inverted yield curve. A less inverted yield curve can result from reduced recession risk, an improved economic outlook, and/or expectations of interest rate cuts by central banks—all of which would support consumer spending. Looking at some of the top holdings, Alphabet’s Search segment had an excellent quarter, with their Cloud business crossing $10 billion in quarterly revenues and $1 billion in quarterly operating profits for the first time. Meta has launched Meta AI with Llama 3, and Reels now make up 50% of user time spent on Instagram. Netflix had strong performance across the board, with good momentum, strong revenue growth, member growth, and profit growth (especially in India). We remain neutral relative to the benchmark but are ready to add if the technical indicators show broader-based improvement.
Figure 8: Earnings revisions are also rolling over for the Communication Services sector.
Energy: The Composite model held relatively steady and remained in neutral territory. There were no significant indicator changes with the August update. Both the Internal and External composites are mixed. For example, negative factors include momentum, OBOS, rolling volatility, valuation (based on cash flow), and inventories. Positive supports include breadth improvement, pessimistic crude futures crowd sentiment, crude spot prices, and the U.S. dollar. Exxon Mobile and Chevron make up about 45.5% of the sector, and both report earnings on 8/2/24. As described last month, OPEC+ extended 3.6 mbd of existing cuts until the end of 2025, focusing on undercompliance. We view the OPEC announcement as providing a floor for global crude oil prices in 2024. We remain with a neutral allocation.
Figure 9: Inventories are approaching the low levels that have historically been associated with support.
Financials: The Composite model is unchanged and remains neutral. Technical indicators are supportive but indicators defining the sector’s operating environment are mixed. Measures of momentum, trend, downside volatility, business credit conditions, sector-specific credit spreads, and a wider yield curve are supportive. Negative indicators include the U.S. Economic Surprise Index showing economic releases missing expectations, on average, over the past three months, the U.S. dollar trending lower, weaker bank loan growth, and relatively expensive valuations. Currently, the net result of the indicators is a neutral weighting.
Figure 10: The Financials sector has rebounded from the oversold conditions highlighted in last month’s Update.
Health Care: The Composite model improved, with the technical indicators catching up to the positive external model’s message. Measures of trend, momentum, breadth, and downside volatility are positive. Medical care inflation, valuations, and sector-specific credit spreads are also positive. The lone negative is health care new construction, which has been tailing off as commercial real estate works through excess inventory. We remain overweight.
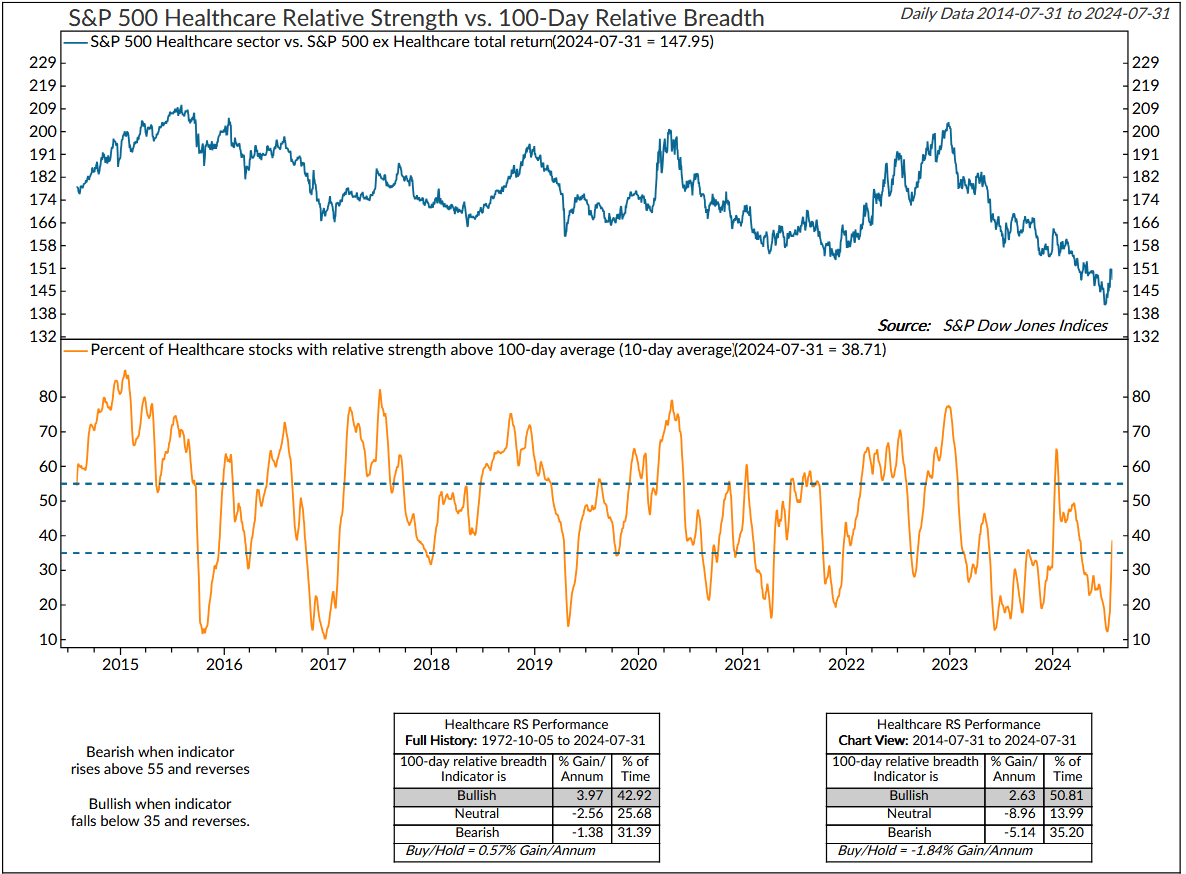
Figure 11: Health Care sector breadth is improving from deeply oversold levels.
Industrials: The Composite model improved last month due to new buy signals from indicators calling short-term relative momentum and a reversal from oversold conditions. However, recent weakness from the commodity complex and the U.S. dollar are headwinds. The top holding in the fund is General Electric. In its Q2 earnings report, General Electric has demonstrated consistent revenue growth across its segments over the past year. The aerospace segment remains the largest contributor to the company’s revenue, followed by renewable energy and power segments. The quarterly and annual data indicate a positive trend in revenue growth, driven by strong performance in both equipment and services revenue. The net result is now a neutral exposure relative to the benchmark.

Figure 12: Momentum starting to reverse from oversold levels.
Information Technology: The Composite model declined slightly with the August update, primarily due to technical indicators becoming less supportive. Momentum is waning at the same time the sector is deemed overbought on a short-term basis. Additionally, while there has been some breadth improvement, it hasn’t been enough to flip our IT-sector breadth indicator positive. Valuations are stretched overall, and the relative short-interest ratio is starting to increase, meaning that investors are starting to hedge their positions. The top 3 holdings have shifted back to Microsoft (21.5% of the ETF’s holdings), Nvidia (19.9%), and Apple (down to just 4.89%). On July 25, in response to the information technology sector model having moderated to a more neutral level, we took approximately 4% of combined exposure off the table by booking profits from our XLK (the Technology Select Sector SPDR Fund) and MAGS (Magnificent Seven ETF) positions. Entering July, we were heavily invested in the sector due to positive internal and external indicators. The number of new highs was increasing, and other breadth indicators were close to signaling a buy. We suggested that it might be time for the troops to support the generals. We mentioned last month that the sector was overbought, but sometimes overbought conditions can persist. However, at this point, while a clear reversal has not happened, a few of our short-term indicators are showing signs of exhaustion. Our model indicates that there is currently less support for the bullish trend, so being significantly overweight is no longer justified. We note that the positioning for upside in the MAGS remains overextended, as investors are fully committed to these stocks. With investors still quite optimistic, companies will need strong earnings performance to meet expectations, and it is becoming less certain that the earnings growth will materialize. NVDA is now trading at 23.3 times forward sales (not earnings), down from 25.3 times on July 1st. For comparison, Microsoft is at 13.0 times (compared to 13.6x on July 1) and Apple is at 8.7 times (compared to 8.4x on July 1). We are neutral.
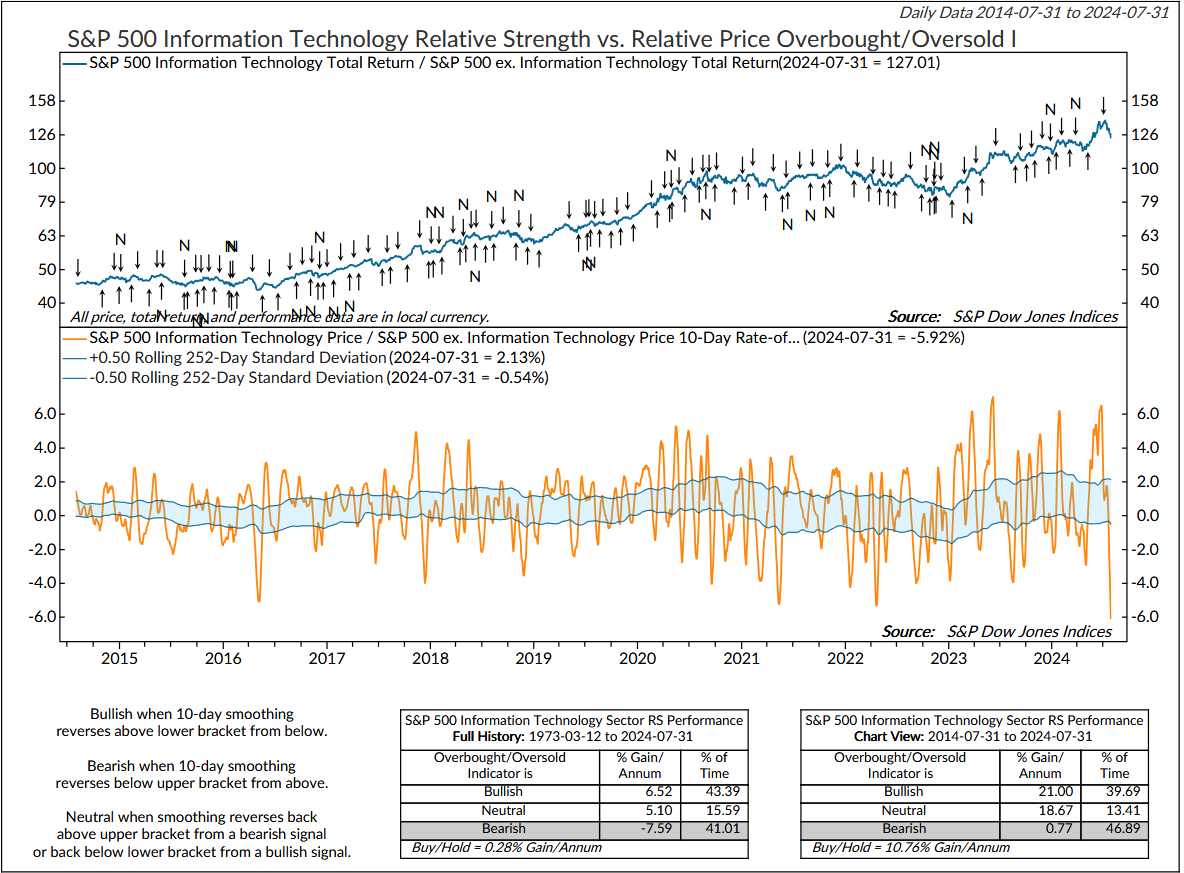
Figure 13: Go with the flow until it reaches an extreme and reverses. This particular OBOS indicator flipped to a sell signal when the 10-day rate of change declined below the top bracket, causing us to reduce exposure.
Materials: The Composite model improved but remains at bearish levels. The Internal and External composites are negative. There are some technical green shoots, with shorter-term measures of relative price momentum and oversold conditions turning bullish. However, other indicators have yet to confirm. Valuations are not yet inexpensive relative to earnings growth expectations, and commodity price weakness continues to plague the sector’s upside opportunities. We are underweight.
Figure 14: Industrial Production for materials is one of the few indicators on a buy signal for the materials sector. If more technical improvement occurs and raises the Composite model, we’ll add exposure. But until then, we will stay in line with the model’s message.
Real Estate: The Composite model improved but still remains at the low end of the neutral range. The Internal composite is bearish, and the External composite is bullish. Measures of trend, breadth, and deviation from trend are negative, though with prices at current levels, there may be a mean reversion opportunity in the near future. We’re monitoring the other technical indicators for confirmation, which have not yet materialized. Better housing numbers over the past few weeks have been encouraging. The Homebuilders sub-industry index has been on a buy, and lower interest rates and the MBA Purchase Index are supportive. We also note that the Industrial Production trend for construction supplies has turned positive. There are still lots of problems with CRE loans, with $1 trillion coming due over the course of this year. We remain underweight but will add exposure if the models start to gain traction.
Figure 15: Breadth is improving, but it is not yet on a buy signal. Over the preceding three weeks, most of the improvement was from heavily shorted names.
Utilities: The Utilities Composite model has improved, and we have increased exposure in response. Several technical indicators (moving averages, price reversals, oversold/overbought, relative breadth) have flipped to buy signals, while some better economic news in the U.S. is showing up in the recent Manufacturing PMI results. We are now neutral.
Figure 16: The Utilities sector has a negative correlation to U.S. Manufacturing PMI trends. (Higher PMIs = stronger economy = potentially higher interest rates = competition for yield-sensitive investors holding utility stocks.)
Our goal is to stay on the right side of the prevailing trend, introducing risk management when conditions deteriorate. Currently, the uptrend remains intact. As has been the case for all of 2024, the broader-based composite models calling U.S. economic growth, international economic growth, inflation trends, liquidity, and equity demand remain constructive. The Catastrophic Stop model is positive, and we are aligned with the message. If our models shift to bearish levels, we will raise cash.
This strategy uses measures of price, valuation, economic trends, monetary liquidity, and market sentiment to make objective, unemotional, rational decisions about how much capital to place at risk and where to place that capital.
For more information, please contact us at:
Day Hagan Asset Management
1000 S. Tamiami Trl
Sarasota, FL 34236
Toll Free: (800) 594-7930
Office Phone: (941) 330-1702
Website: https://dayhagan.com or https://dhfunds.com
Charts courtesy Ned Davis Research (NDR). © Copyright 2024 NDR, Inc. Further distribution prohibited without prior permission. All Rights Reserved. See NDR Disclaimer at www.ndr.com/copyright.html. For data vendor disclaimers refer to www.ndr.com/vendorinfo.
Day Hagan/Ned Davis Research
Smart Sector® With Catastrophic Stop ETF
Symbol: SSUS
Disclosures
The data and analysis contained within are provided "as is" and without warranty of any kind, either express or implied. The information is based on data believed to be reliable, but it is not guaranteed. Day Hagan DISCLAIMS ANY AND ALL EXPRESS OR IMPLIED WARRANTIES, INCLUDING, BUT NOT LIMITED TO, ANY WARRANTIES OF MERCHANTABILITY, SUITABILITY, OR FITNESS FOR A PARTICULAR PURPOSE OR USE. All performance measures do not reflect tax consequences, execution, commissions, and other trading costs, and as such, investors should consult their tax advisors before making investment decisions, as well as realize that the past performance and results of the model are not a guarantee of future results. The Smart Sector® Strategy is not intended to be the primary basis for investment decisions and the usage of the model does not address the suitability of any particular in Fixed Income vestment for any particular investor.
Using any graph, chart, formula, model, or other device to assist in deciding which securities to trade or when to trade them presents many difficulties and their effectiveness has significant limitations, including that prior patterns may not repeat themselves continuously or on any particular occasion. In addition, market participants using such devices can impact the market in a way that changes the effectiveness of such devices. Day Hagan believes no individual graph, chart, formula, model, or other device should be used as the sole basis for any investment decision and suggests that all market participants consider differing viewpoints and use a weight-of-the-evidence approach that fits their investment needs.
Past performance does not guarantee future results. No current or prospective client should assume future performance of any specific investment or strategy will be profitable or equal to past performance levels. All investment strategies have the potential for profit or loss. Changes in investment strategies, contributions or withdrawals and economic conditions may materially alter the performance of your portfolio. Different types of investments involve varying degrees of risk, and there can be no assurance that any specific investment or strategy will be suitable or profitable for a client’s portfolio. Historical performance results for investment indexes and/or categories generally do not reflect the deduction of transaction and/or custodial charges or the deduction of an investment management fee, the incurrence of which would have the effect of decreasing historical performance results. There can be no assurances that a portfolio will match or outperform any particular benchmark.
Day Hagan Asset Management is registered as an investment adviser with the United States Securities and Exchange Commission. SEC registration does not constitute an endorsement of the firm by the Commission nor does it indicate that the adviser has attained a particular level of skill or ability.
There may be a potential tax implication with a rebalancing strategy. Re-balancing involves selling some positions and buying others, and this activity results in realized gains and losses for the positions that are sold. The performance calculations do not reflect the impact that paying taxes would have, and for taxable accounts, any taxable gains would reduce the performance on an after-tax basis. This reduction could be material to the overall performance of an actual trading account. Day Hagan does not provide legal, tax or accounting advice. Please consult your tax advisor in connection with this material, before implementing such a strategy, and prior to any withdrawals that you make from your portfolio.
There is no guarantee that any investment strategy will achieve its objectives, generate dividends or avoid losses.
© 2024 Day Hagan Asset Management
