
Day Hagan Smart Sector® International Strategy Update September 2024
A downloadable PDF copy of the Article:
Day Hagan Smart Sector® International Strategy Update September 2024 (pdf)
Catastrophic Stop Update
The Catastrophic Stop model combines time-tested, objective indicators designed to identify high-risk periods for the equity market. The model (Figure 1) declined toward the end of August but entered September with a fully invested equity allocation recommendation.
Figure 1: Catastrophic Stop Model vs. S&P 500 Total Return Index
The model’s decline was due to the Short-Term Trend, U.S. Stock/Bond Relative Strength, High Yield OAS, and Baltic Dry Index Factors shifting to negative levels.
Figure 2: The Short-term Trend Factor is hovering around neutral levels. A decisive move in either direction would quickly be reflected in the overall model.
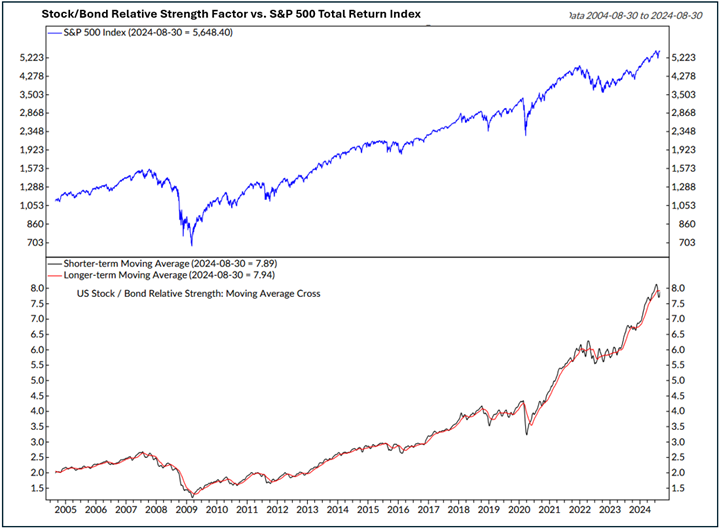
Figure 3: The U.S. Stock/Bond Relative Strength Factor also reversed to a sell signal. The previous buy signal had been in place since November 17, 2023. When bonds evidence relative strength, it has historically been a good indication that the demand for equities is transitioning to a more risk-off or defensive posture.
Figure 4: The same holds true for our measures of credit spreads. For example, high-yield OAS could quickly reverse to bullish levels. Even though the indicator has generated a sell signal, it wouldn’t take much to reverse it. The High-yield OAS moving averages have ticked higher but are still at historically low levels. This indicates that the financial markets are behaving relatively normally. A spike higher would be concerning.

Figure 5: Economic activity has declined slightly, but real GDP growth is still positive overall. The Baltic Dry Index Factor has moved moderately lower (chart above).
Entering August, our investment models continue to convey a cautiously optimistic outlook for global equity markets collectively. For instance, the Global Recession Probability Model assigns a low probability of a broad-based significant global slowdown but is moving toward more neutral levels. An increase above 30 would be concerning. The model is based on the Composite Leading Indicators for 35 countries and includes measures of money supply, yield curve, building permits, consumer and business sentiment, share prices, and manufacturing.

Figure 6: Global Recession Probability Model indicates risks rising but not yet crossing important thresholds.
The global financial and economic landscape in August 2024 was marked by significant volatility. In the U.S., a sharp downturn in stock markets occurred due to weaker-than-expected July non-farm payroll data, leading to a 3% drop in the S&P 500 and Nasdaq on August 5. The volatility index surged (peaking above 65), reflecting heightened investor anxiety.
The decline was exacerbated by the Bank of Japan’s unexpected interest rate hike on the same day, which resulted in the Nikkei 225 plummeting over 12%. This led to the yen’s strengthening and unwinding of the yen carry trade, intensifying global market instability. Geopolitical risks, including ongoing trade issues and uncertainty surrounding the upcoming U.S. elections, added to market volatility, fostering risk aversion among investors.
Despite the initial turbulence, U.S. equity markets saw a mid-August recovery. However, European and Asian markets struggled, with slowing growth in China significantly impacting German equities and other export-dependent sectors. These events showcased the continued interconnectedness of global financial markets and the susceptibility of markets to both domestic and international factors.
The U.S. has experienced a robust post-pandemic recovery, surpassing other advanced economies. However, challenges are emerging, including increasing unemployment rates alongside decreased core service price inflation, prompting discussions about potential shifts in the Fed’s policy rates and global asset prices. Major central banks, particularly in Europe, are also likely to continue reducing rates, which could benefit equity markets.
In contrast, China, Europe, the UK, and Japan have faced more significant economic challenges, such as slower growth, persistent unemployment, and geopolitical tensions. These global economic dynamics have implications for divergent monetary policy paths, relative currency trends, and financial market performance. Despite these challenges, the recovery of the U.S. economy and the potential for a dovish shift in Fed policy rates, along with other central banks, remains noteworthy. Despite the complexity, the environment for global equity markets entering 2024 is characterized by cautious optimism.

Figure 7: Global Purchasing Manager Index still in expansion territory but moving lower. It would be concerning if the Services PMI (light blue) dropped below 50.
Core: Developed Market Positions (approximately 65% of equity holdings)
Country
Australia
Canada
China
France
Germany
Japan
Switzerland
United Kingdom
Outlook
Underweight
Overweight
Overweight
Underweight
Neutral
Underweight
Underweight
Overweight
Explore: Emerging Market Positions (approximately 35% of equity holdings)
Israel
Peru
Netherlands
Taiwan
New Zealand
Core: Developed Market Commentary
Approximately 65% of the strategy is allocated across eight of the largest markets in the ACWI ex-U.S. Index. The fund overweights and underweights the largest non-U.S. equity markets based on macro, fundamental, behavioral, and technical indicators. Weightings are determined using the Black-Litterman framework, which seeks to reduce volatility and enhance returns.
Australia: The Australian dollar hovered near year-to-date highs at around $0.68, on track to gain almost 4% for the month due to strong domestic inflation, which supported a hawkish outlook on the Reserve Bank of Australia monetary policy. The U.S. dollar’s broad weakness also contributed to the Aussie’s strength, as the Federal Reserve is expected to cut interest rates in September. Australia’s monthly CPI indicator rose 3.5% in the year to July, slightly below the 3.8% gain in June but exceeding forecasts of 3.4%. Though it considered raising rates to tame inflation, the Reserve Bank of Australia (RBA) kept its cash rate unchanged at 4.35% during its August meeting, citing concerns about inflation remaining above the 2–3% target range. In Australian manufacturing, the sector’s health saw a slower deterioration in August, with weak new orders leading to further production declines. Export orders, however, grew, mitigating the overall sales decline. The Services PMI Business Activity index rose to 52.2 in August, marking the fastest expansion in services output in three months, supported by stronger demand and a growing customer base, although new business from abroad continued to decline. For September, the Composite model declined, with measures of trend, relative currency changes, and valuation (relative earnings yield) negative. Higher gold prices and oversold conditions are supportive. We remain underweight.
Figure 8: Australia’s Economic Surprise Index has turned positive, indicating that economic releases have been outpacing expectations, on average, over the past three months.
Canada: The Canadian dollar traded near 1.35 per USD, close to its five-month high of 1.344 (on August 7), following positive Q2 2024 GDP growth of 2.1%, alleviating concerns of economic stagnation. The S&P Global Canada Composite PMI fell to 47.0 in July 2024, signaling a sharper contraction in private sector output, largely due to a significant drop in manufacturing production. However, there are signs of potential stabilization in the service sector. The CFIB’s Business Barometer in Canada, reflecting 12-month forward expectations, rose to a two-year high of 56.8 in August 2024. The unemployment rate remained unchanged at 6.4% in July 2024, slightly below expectations. Overall, the economic data suggests mixed performance, with positive GDP growth but challenges in the private sector output and labor market softening, influencing expectations for the Bank of Canada’s continued dovish monetary policy. The Composite model turned higher this month, with positive technical and fundamental indicators, including mean reversion, trend, leading economic indicators, currency translation, and valuations, supportive. We are overweight.
Figure 9: Earnings revisions are positive.
China: China’s Composite model was virtually unchanged with the September update. A mean-reversion indicator flipped to a sell, while an Emerging Market High-Yield Credit spread indicator turned positive as credit spreads narrowed. In August, the People’s Bank of China kept key lending rates unchanged, in line with expectations. The one-year loan prime rate remained at 3.45%, while the five-year rate stayed at 3.85%, both at record lows following July’s surprise rate cuts. There’s a shift in focus from quantitative targets to price-based tools like interest rates. China’s official NBS Non-Manufacturing PMI rose to 50.3 in August, marking the 20th consecutive month of service sector expansion, although business confidence slightly weakened. Dollar selling by Chinese firms may surge, potentially driving up the yuan, influenced by speculation about U.S. Federal Reserve rate cuts. Additionally, the offshore yuan is poised to gain nearly 2% against the dollar, its best performance since December 2023. The Composite model remains bullish, with relative momentum, relative strength, PMI trends (although slightly lower recently), and currency strength positive. Emerging market bond credit spreads have narrowed. We remain slightly overweight.
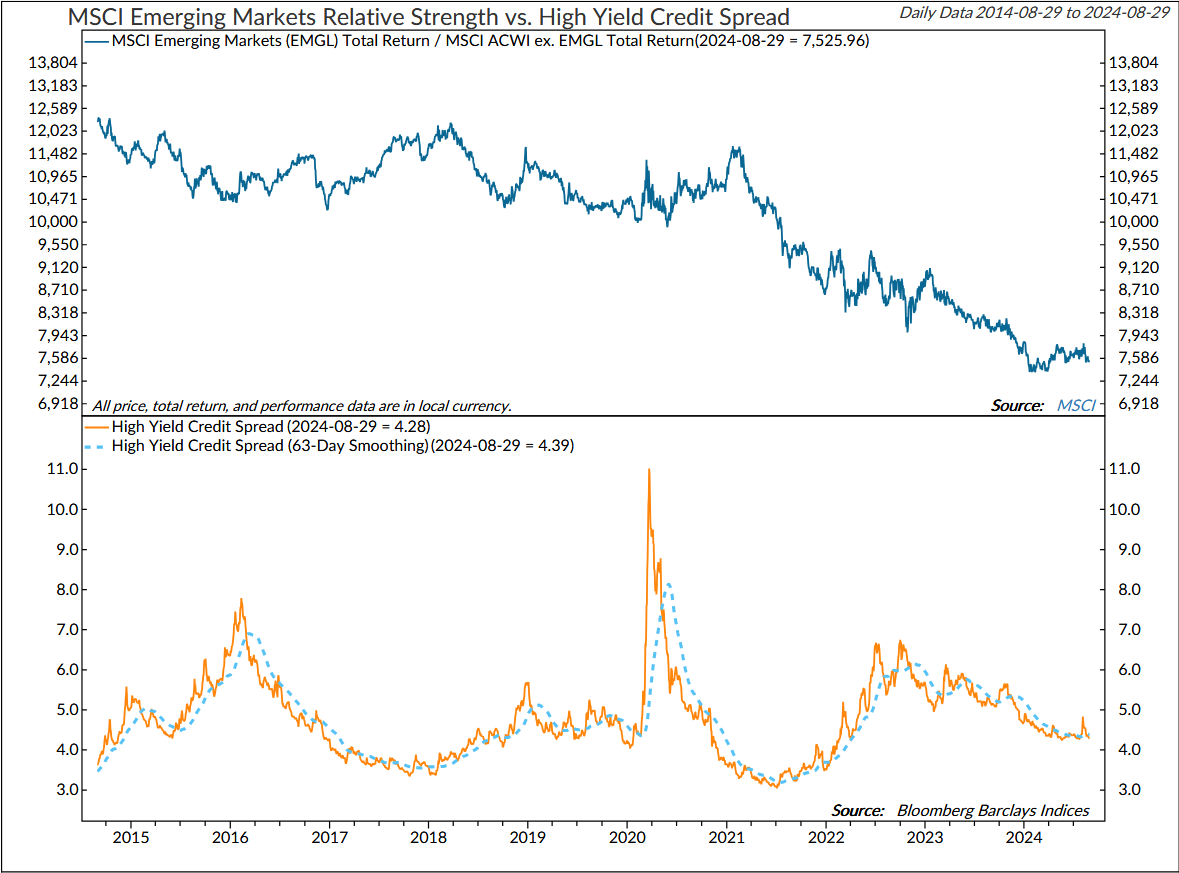
Figure 10: EM High-yield credit spreads have retreated, and levels are still relatively low. This indicates that investors aren’t yet anticipating a significant financial disruption.
Figure 10a: China’s Forward P/E remains near historically low levels.
France: The Composite model remains bearish, with negative measures of trend, breadth, valuation, and ETF flows. In August 2024, Eurozone inflation slowed to 2.2%, while annual consumer price inflation dropped to 1.9%, the lowest rate since 2021. Producer inflation moderated to 5.4% in July. France’s annual inflation rate decreased to 1.9% in August 2024, with energy prices sharply slowing to 0.5% from 8.5% in July. The French economy expanded by 0.2% in Q2 of 2024, below initial estimates. Yet, the latest HCOB France Manufacturing PMI results fell to 42.1, marking the 19th consecutive month of contraction. Conversely, the HCOB France Services PMI rose to 55.0, indicating the second consecutive month of growth and the sharpest pace in over two years. Employment in France increased marginally but at the weakest pace since January. Given the bearish Composite model and France’s struggle to stimulate its economy, we remain underweight.
Figure 11: French 10-year rates have rolled over, but relative to Germany, they are still elevated, which is a headwind.
Germany: Germany’s economy is facing challenges, with weak GDP growth and declining business sentiment. In the second quarter of 2024, the GDP remained stagnant, with weak consumer spending and a significant fall in fixed investment. The Ifo Business Climate indicator dropped to 86.6 in August 2024, indicating increased pessimism among companies. The HCOB Flash Germany Manufacturing PMI fell to 42.1 in August 2024, showing a sharp decline in the manufacturing sector for 26 consecutive months. Similarly, the HCOB Germany Services PMI dropped to 51.4 in August 2024, indicating a slowdown in the service sector. These weak economic indicators suggest that Germany’s economy is increasingly at risk of continued underperformance. The Composite model is mixed, with negative trend indicators, aggregate valuations, and asset outflows. A relatively high dividend yield, some improvement in manufacturing (though still at low levels), and the U.S. dollar stalling (relative to the euro) are bullish. We remain neutral.
Figure 12: Germany’s Forward P/E is back to the long-term average.
Japan: The Japanese yen recently traded at a three-week high, as expectations of U.S. Federal Reserve interest rate cuts weighed on the dollar and boosted other major currencies. While Fed officials are concerned about labor market risks, they remain confident that inflation will reach its target, hinting at potential rate cuts. In contrast, Bank of Japan Governor Kazuo Ueda stated that the central bank may adjust its monetary policy if economic projections are met, signaling a willingness to increase rates. The Japanese economy grew by 3.1% in Q2 of 2024, surpassing the market consensus of 2.1%, driven by a rebound in private consumption and business spending, particularly in the automotive industry. The Bank of Japan Services PMI increased to 54.0 in August 2024, showing sustained growth in new orders, while the Manufacturing PMI decreased to 49.5, indicating the second consecutive month of contraction in factory activity. Interestingly, the consumer confidence index in Japan rose to 36.7 in July 2024, marking the highest level since April. Given the diverging data, the Internal and External indicators remain neutral on balance, with measures of breadth, volatility, and sentiment positive. Conversely, new lows are expanding, the trend is still suspect, and momentum is negligible. China’s manufacturing PMI indicator, relative valuations, and diverging policy rate path (definitely higher for longer) are negative. We remain underweight.
Figure 13: Japan’s Economic Surprise Index indicates that expectations are still too optimistic.
Switzerland: The Swiss Franc strengthened to 0.85 against the USD, reaching levels unseen since the start of the year due to dollar weakness amidst U.S. economic concerns after a disappointing jobs report. (Speculation arises that the Fed may cut interest rates three times this year.) Economic slowdown worries led to a flight-to-safety strategy. Conversely, Switzerland’s annual inflation rate remained at 1.3% in July, aligning with predictions and reinforcing expectations of a third consecutive rate cut by the Swiss National Bank in September. The KOF Economic Barometer rose to 101.6 in August, surpassing market expectations and signifying a cautious economic recovery. Swiss consumer confidence improved to -32.4 in July from the previous month’s -36.6, albeit remaining pessimistic. Improvement was seen in expected economic development, financial situation, savings, and job security concerns. The Composite model is negative. Measures of breadth, trend, and asset flows are negative. There have also been significant ETF-related outflows. We are underweight the benchmark.
Figure 14: Breadth continues to deteriorate in Euro Area equity markets.
United Kingdom: The British pound is currently trading near $1.32, marking its highest level in over two years and poised for a substantial 3.2% gain in August, the most significant increase since November 2023. This surge is being driven by strong expectations of diverging monetary policies between the U.S. and the UK. The Bank of England has already reduced its main interest rate to 5%, with traders anticipating further cuts totaling 41 basis points by year-end. In contrast, the Federal Reserve is expected to implement larger rate reductions, potentially up to 103 basis points this year, including speculation of a 50-basis point cut next month. Furthermore, both UK manufacturing and services PMI have shown clear expansion, indicating robust activity in these sectors, despite lingering concerns highlighted by the GfK Consumer Confidence indicator remaining at -13 in August 2024. Additionally, the CPI in the United Kingdom experienced a 0.2% month-over-month decrease in July 2024, marking its first decline in six months. The Composite model remains bullish, supported by trend, positive earnings revisions trends, relative currency strength (GBP vs. USD), valuations, and sentiment. We are overweight.
Figure 15: Earnings revisions are trending positively.
Emerging Market Positions
Approximately 35% of the strategy is allocated across five markets from a pool of more than 20 smaller markets. Selection is based on a multifactor technical ranking system using trend and mean reversion indicators.
Current Holdings:
Israel
Peru
Netherlands
Taiwan
New Zealand
Explore: Emerging Market Commentary
Each of the five emerging markets is supported by favorable price trends, with 50-day moving averages trading above the 200-day moving averages. All also show rising 200-day moving averages.
Expected one-year earnings growth: Israel (+4.0%), Peru (+16.9%), Taiwan (+21.9%), Netherlands (+15.3%), and New Zealand (+12.4%). (All data based on MSCI constituent holdings.)
Forward P/Es are as follows: Israel (12.1x), Peru (11.7x), Taiwan (18.4x), Netherlands (18.4x), and New Zealand (35.1x).
All five countries are supported by increasing forward earnings estimates.
Israel, Peru, Netherlands, and New Zealand have low market capitalization-to-GDP ratios (below 1.0), which typically indicate a favorable valuation. Taiwan is more expensive at 1.89x.
Peru, Netherlands, New Zealand, and Taiwan are currently oversold on a short-term (21-day) basis. Such oversold conditions may provide a near-term bounce opportunity.
Except for Peru, which is an emerging market, the other countries—Israel, Taiwan, New Zealand, and the Netherlands—have highly developed and sophisticated financial markets. This makes them attractive to international investors looking for stability and growth opportunities.
All these countries have relatively small to mid-sized economies compared to global giants like the U.S., China, or the Eurozone. Their stock markets are less influential on a global scale, but they often show resilience and can be attractive to investors seeking diversification.
Their stock markets feature a broad mix of industries. For instance, Peru has a strong presence in mining, Israel in technology and pharmaceuticals, Taiwan in semiconductors and electronics, New Zealand in agriculture and renewable energy, and the Netherlands in finance, technology, and consumer goods.
Generally, these countries have stable political environments, which contributes to the relative stability of their stock markets. Even in times of global uncertainty, these markets tend to be less volatile compared to those in politically unstable regions.
Israel and Taiwan, in particular, are known for their technology sectors. Israel is often referred to as the "Startup Nation" due to its large number of tech startups and innovations, while Taiwan is a major player in the semiconductor industry. The Netherlands also has a strong tech sector, and New Zealand has been increasingly investing in tech and renewable energy.
Despite their smaller size, these markets often attract global investors seeking to diversify their portfolios, particularly those looking for exposure to specific sectors like technology, agriculture, or commodities.
This strategy utilizes measures of price, valuation, economic trends, monetary liquidity, and market sentiment to make objective, unemotional, rational decisions about how much capital to place at risk and where to place that capital.
For more information, please contact us at:
Day Hagan Asset Management
1000 S. Tamiami Trl
Sarasota, FL 34236
Toll Free: (800) 594-7930
Office Phone: (941) 330-1702
Website: https://dayhagan.com or https://dhfunds.com
© 2024 Day Hagan Asset Management
Charts courtesy Ned Davis Research (NDR). © Copyright 2024 NDR, Inc. Further distribution prohibited without prior permission. All Rights Reserved. See NDR Disclaimer at www.ndr.com/copyright.html. For data vendor disclaimers refer to www.ndr.com/vendorinfo.
Day Hagan/Ned Davis Research
Smart Sector® International ETF
Symbol: SSXU
Strategy Description
The Smart Sector® International strategy combines three quantitative investment strategies: Core International, Explore International, and Catastrophic Stop.
The Process Is Based On The Weight Of The Evidence
Core Allocation
The fund begins by overweighting and underweighting the largest non-U.S. equity markets based on proprietary models.
Each of the models utilizes market-specific, weight-of-the-evidence composites of fundamental, economic, technical, and behavioral indicators to determine each area’s probability of outperforming the ACWI, for example. U.S. Markets are weighted accordingly relative to benchmark weightings.
Explore Allocation
To select smaller markets, the fund uses a multi-factor technical ranking system to choose the top markets. The markets with the highest rankings split the non-core model allocation equally.
When Market Risks Become Extraordinarily High — Reduce Your Portfolio Risk
The model remains fully invested unless the Catastrophic model is triggered, whereupon the equity-invested position may be trimmed by up to 50%.
The Catastrophic Stop model combines time-tested, objective indicators designed to identify periods of high risk for the broad U.S. equity market. The model uses price-based, breadth, deviation from trend, fundamental, economic, interest rate, behavioral, and volatility-based indicator composites.
When Market Risks Return To Normal — Put Your Money Back To Work
When the Catastrophic Stop model moves back to bullish levels, indicating lower risk, the strategy will reverse toward being fully invested.
Disclosures
The data and analysis contained within are provided "as is" and without warranty of any kind, either express or implied. The information is based on data believed to be reliable, but it is not guaranteed. Day Hagan DISCLAIMS ANY AND ALL EXPRESS OR IMPLIED WARRANTIES, INCLUDING, BUT NOT LIMITED TO, ANY WARRANTIES OF MERCHANTABILITY, SUITABILITY, OR FITNESS FOR A PARTICULAR PURPOSE OR USE. All performance measures do not reflect tax consequences, execution, commissions, and other trading costs, and as such, investors should consult their tax advisors before making investment decisions, as well as realize that the past performance and results of the model are not a guarantee of future results. The Smart Sector® Strategy is not intended to be the primary basis for investment decisions and the usage of the model does not address the suitability of any particular in Fixed Income vestment for any particular investor.
Using any graph, chart, formula, model, or other device to assist in deciding which securities to trade or when to trade them presents many difficulties and their effectiveness has significant limitations, including that prior patterns may not repeat themselves continuously or on any particular occasion. In addition, market participants using such devices can impact the market in a way that changes the effectiveness of such devices. Day Hagan believes no individual graph, chart, formula, model, or other device should be used as the sole basis for any investment decision and suggests that all market participants consider differing viewpoints and use a weight-of-the-evidence approach that fits their investment needs.
Past performance does not guarantee future results. No current or prospective client should assume future performance of any specific investment or strategy will be profitable or equal to past performance levels. All investment strategies have the potential for profit or loss. Changes in investment strategies, contributions or withdrawals and economic conditions may materially alter the performance of your portfolio. Different types of investments involve varying degrees of risk, and there can be no assurance that any specific investment or strategy will be suitable or profitable for a client’s portfolio. Historical performance results for investment indexes and/or categories generally do not reflect the deduction of transaction and/or custodial charges or the deduction of an investment management fee, the incurrence of which would have the effect of decreasing historical performance results. There can be no assurances that a portfolio will match or outperform any particular benchmark.
Day Hagan Asset Management is registered as an investment adviser with the United States Securities and Exchange Commission. SEC registration does not constitute an endorsement of the firm by the Commission nor does it indicate that the adviser has attained a particular level of skill or ability.
There may be a potential tax implication with a rebalancing strategy. Re-balancing involves selling some positions and buying others, and this activity results in realized gains and losses for the positions that are sold. The performance calculations do not reflect the impact that paying taxes would have, and for taxable accounts, any taxable gains would reduce the performance on an after-tax basis. This reduction could be material to the overall performance of an actual trading account. Day Hagan does not provide legal, tax or accounting advice. Please consult your tax advisor in connection with this material, before implementing such a strategy, and prior to any withdrawals that you make from your portfolio.
There is no guarantee that any investment strategy will achieve its objectives, generate dividends or avoid losses.
© 2024 Day Hagan Asset Management
