
Day Hagan Smart Sector® International Strategy Update July 2025
A downloadable PDF copy of the Article:
Day Hagan Smart Sector® International Strategy Update July 2025 (pdf)
Executive Summary
Global Equity Performance: A Regional Snapshot
Global equities performed well in June, driven by a confluence of dovish central bank policies, divergent economic releases, and gyrating trade dynamics in the U.S., China, the Eurozone, Canada, Japan, and the Pacific region. The U.S. Federal Reserve’s decision to hold interest rates steady at 4.25%-4.50% initially set a cautious tone, due to an upward revision of its 2025 inflation forecast to 3.1% reflecting concerns over potential tariff-driven price pressures. This tempered expectations for rate cuts, contributing to market uncertainty. However, Fed projections indicate that inflation is expected to increase through 2025 and moderate quickly thereafter, while international inflation statistics generally shifted lower.
Economic data presented more of a mixed picture: In the U.S., robust job growth signaled labor market resilience, but a 0.5% contraction in GDP, driven by weaker consumer spending and exports, raised concerns. Projections of a stronger Q2 (illustrated by the Atlanta Fed’s GDPNow model), alongside a services PMI rebound, provided some optimism, particularly for technology-focused sectors.
In China, markets responded to signals of potential tariff de-escalation with the U.S., fostering cautious optimism. The People’s Bank of China maintained its benchmark rate at 3.1% but hinted at stimulus measures to support exports, which bolstered sentiment in the technology and consumer goods sectors. However, ongoing real estate challenges continued to weigh on investor confidence.
The Eurozone saw the European Central Bank cut its Deposit Rate to 2.0%, adopting a neutral stance to assess the impacts of tariffs until a deal is reached. Resilient services activity contrasted with manufacturing weakness, influencing investor focus on utilities and renewable energy, while export-heavy sectors faced headwinds from trade uncertainties.
Canada’s markets were supported by the Bank of Canada’s 0.25% rate cut to 3.75%, aimed at stimulating growth amid cooling inflation. Strong commodity prices, particularly in oil, initially supported resource-driven sectors; however, concerns about tariffs restrained manufacturing optimism, and prices reverted by the end of the month.
A key focus was Japan, where the Bank of Japan (BoJ) raised its policy rate to 0.5% in January, the highest in 17 years, and maintained it in June, contrary to earlier suggestions of a pause. This decision, driven by persistent inflation at around 3% and rising wage growth, strengthened the yen, which in turn supported Japanese equity markets (attracting investor inflows). However, Governor Kazuo Ueda’s cautious, data-driven approach, citing risks from U.S. tariffs, tempered expectations for further hikes, and introduced some market uncertainty. An overly strong yen would be a problem for their export-based economy.
Australia benefited from sustained commodity demand, particularly in the mining and energy sectors, while South Korea’s technology sector remained a focal point; however, trade policy uncertainties tempered enthusiasm. Across all regions, utilities gained traction due to rising demand for data centers, while consumer cyclical sectors faced challenges from tariff-related risks. Geopolitical tensions, notably in the Middle East, temporarily elevated oil prices, adding a layer of caution to global markets. Overall, most markets were able to look past the volatile economic underpinnings and deliver substantial gains.
Conclusion
June’s strong returns were shaped by a delicate balance of mostly dovish monetary policy decisions, stabilizing economic indicators (though at lower levels), and mixed geopolitical tensions, with central bank actions and tariff negotiations serving as key drivers of market sentiment.
Holdings
Core: Developed Market Positions (approximately 65% of equity holdings)
Country
Australia
Canada
China
France
Germany
Japan
Switzerland
United Kingdom
Outlook
Neutral
Neutral
Overweight
Underweight
Underweight
Overweight
Underweight
Underweight
Explore: Emerging Market Positions (approximately 35% of equity holdings)
Philippines
Chile
Sweden
Poland
Singapore
Position Details
Core: Developed Market Commentary
Approximately 65% of the strategy is allocated across eight of the largest markets in the ACWI ex-U.S. Index. The fund overweights and underweights the largest non-U.S. equity markets based on macro, fundamental, behavioral, and technical indicators.
Australia: Australia’s composite model remains neutral. Measures of trend and relative volatility are positive, while interest rate differentials, declining relative corporate profitability, and historically stretched relative valuations are negative. Gold trends are now neutral. We continue to hold a neutral allocation.
Commentary: The Reserve Bank of Australia (RBA) reduced its cash rate by 25 basis points to 3.85% during its May meeting, marking the first cut since January and aligning with market forecasts. This adjustment has brought borrowing costs to their lowest level in two years, as both headline and underlying inflation have fallen within the RBA’s target range of 2-3%. The board acknowledged that inflation risks are now more balanced, yet the outlook remains uncertain due to fluctuations in global trade policy, particularly influenced by rising U.S. tariffs. The RBA is preparing for potential adverse scenarios that could severely impact domestic economic activity and inflation. Although GDP growth in Australia is projected to improve, the recovery may be slower, given weakened external demand and reduced consumer spending. The labor market remains robust, with an unemployment rate of 4.1% remaining steady. Despite these developments, the Australian dollar is trading near eight-month highs, even as expectations mount for a third interest rate reduction at the upcoming July 8 monetary policy meeting. The RBA is widely anticipated to cut rates by another 25 basis points in response to cooling inflation and a deteriorating economic outlook.
Figure 1: Weaker trends in gold prices are negative for Australia.
Canada: Canada’s composite model remains neutral. Measures of trend, profitability (ROE), and relative currency strength are supportive. Mean reversion, leading economic indicators, and relative valuations (to the rest of the world) are negative.
Commentary: In June 2025, the Bank of Canada opted to maintain its benchmark interest rate at 2.75%, a decision anticipated by half of market participants. This marks the second consecutive month of holding the rate steady, following a cumulative reduction of 2.25 percentage points over the previous seven meetings. The governing council expressed concerns about the impact of fluctuating U.S. tariffs and the uncertain outcomes of bilateral trade negotiations, which posed downside risks to economic growth while simultaneously raising inflation expectations. The lack of clarity regarding U.S. tariff policies and the potential for new trade actions were highlighted as significant risks, particularly in terms of their effects on Canadian exports. Meanwhile, the Canadian dollar remained stable at 1.365 per USD, close to an eight-month high of 1.354 achieved on June 16. This stability can be attributed to general weakness in the U.S. dollar, influenced by dovish sentiments from the Federal Reserve and recent fiscal concerns following President Trump’s $3.3 trillion tax and spending proposal. In the domestic arena, S&P Global reported a decline in Canada’s Manufacturing PMI to 45.6, the lowest level in over five years, reflecting ongoing contraction in the manufacturing sector amid declining export orders and substantial inventory reductions.
Figure 2: Canada’s recent relative strength continues to roll over as overbought conditions are being worked off.
China: China’s composite model has improved, with indicators evaluating high-yield credit spreads, manufacturing activity, and short-term trends all showing positive trends. Relative price momentum, mean reversion, and relative currency strength indicators are negative, but poised to revert to buy signals in the event of near-term relative strength. Due to the model improvement, we are increasing exposure.
Commentary: The People’s Bank of China (PBoC) maintained key lending rates at historic lows in June, aligning with market expectations. This decision followed a 10-basis-point reduction in borrowing costs the previous month, aimed at mitigating the economic challenges posed by new U.S. tariffs. Additionally, major state-owned banks have recently cut deposit rates. Despite mixed economic indicators, China appears poised to achieve its GDP growth target. Notably, retail sales surged 12.5% year-on-year in May 2025, the fastest increase in 15 months, while industrial output grew only 3.2%, the slowest rate in six months. Furthermore, new bank lending fell short of projections. On the U.S. side, the removal of export restrictions on key technologies, including chip design software and jet engines, signifies an effort to reduce trade tensions as part of a broader bilateral trade agreement. The offshore yuan remained stable at approximately 7.16 per dollar as investors analyzed the latest PMI data. The Caixin General Composite PMI showed expansion, driven by increased manufacturing activity, while the services sector experienced a slowdown, falling to a nine-month low. Official PMI figures indicated contracting manufacturing yet suggested potential gradual improvement.
Figure 3: Relative price momentum showing signs of improvement.
France: The Composite model is underweight. The technical backdrop remains weak, and investor outflows continue to be negative. Leading economic indicators are mixed, but lean negative. We are underweight.
Commentary: Investors grew cautious as they approached the impending U.S. tariff hike deadline next week. Market sentiment was affected by President Trump’s announcement to issue formal letters regarding trade, which increased the possibility of unilateral tariff impositions and heightened uncertainty in global trade relations. Meanwhile, China’s Ministry of Commerce confirmed a five-year tariff of up to 34.9% on EU-origin brandy, effective July 5, 2025. In the manufacturing sector, the HCOB France Manufacturing PMI declined to 48.1 in June 2025 from 49.8 in May, indicating the steepest contraction in four months. This drop was attributed to weak demand in both domestic and international markets, particularly in the automotive sector, as well as a significant decline in new orders. Additionally, new export orders fell more rapidly, while purchasing and inventory activities were reduced due to supplier delays and lengthened delivery times. Conversely, the HCOB France Services PMI increased slightly to 49.6 in June from 48.9 in May, surpassing initial estimates. Despite this improvement, it marked the tenth straight month of contraction in the sector, reflecting ongoing challenges but showing the slowest pace of decline since September 2024.
Figure 4: France has been experiencing investor outflows.
Germany: Following Germany’s massive gains this year, we are taking profits and reducing the allocation to underweight. Technical indicators, including trend and downside volatility, are now negative. Relative valuations indicate that Germany is fully valued. Investor outflows are increasing, and manufacturing confidence is negative.
Commentary: In a bid to manage inflation expectations and prevent undue tightening of financial conditions, the European Central Bank (ECB) implemented its eighth-consecutive interest rate cut last month, as detailed in the minutes from the June 3-5 meeting. Policymakers highlighted the “highly uncertain” global landscape, exacerbated by ongoing trade tensions that are expected to persist and potentially escalate. Given these uncertainties and the risk of inflationary shocks, officials emphasized the need for flexibility, opting away from firm forward guidance. A pause in rate cuts for July appears likely, with a majority of officials advocating for a wait-and-see approach until more definitive data emerges from global trade discussions. Current projections indicate that inflation may dip below the ECB’s 2% target later this year and remain low for approximately 18 months, influenced by a strong euro, declining energy prices, and low-cost imports from China. Market analysts anticipate just one additional rate cut by year-end, with expectations of a shift toward tightening by late 2026. Meanwhile, attention has returned to global trade tensions as the U.S. prepares to announce new tariffs ahead of the July 9 deadline, while EU-U.S. trade talks have yet to yield significant progress.
Figure 5: Longer-term relative breadth measure for Germany hitting resistance and showing signs of rolling over.
Japan: Japan’s composite model remains bullish. Technical indicators, along with measures of the operating environment for Japanese equities, are positive. The stronger yen has not yet been a headwind, and valuations are now neutral. The net result is an overweight position.
Commentary: The Bank of Japan retained its key short-term interest rate at 0.5% during its June meeting, the highest level since 2008, in line with market expectations. This unanimous decision reflects the central bank’s cautious approach amid rising geopolitical tensions and uncertainties regarding U.S. tariff policies, which pose a threat to global economic growth. Following inconclusive trade discussions at the G7 Summit, Tokyo and Washington agreed to extend negotiations. Additionally, the BoJ announced plans to reduce its Japanese government bond purchases by JPY 400 billion each quarter until March 2026, before slowing the pace to JPY 200 billion quarterly through March 2027, aiming for a monthly purchase level of approximately JPY 2 trillion, which indicates a gradual shift away from an ultra-loose monetary policy. Domestically, Japan’s household spending rose 4.7% year-over-year in May, outpacing expectations as efforts to stimulate consumption intensified. In manufacturing, the au Jibun Bank’s PMI was revised down to 50.1 in June 2025 from an initial 50.4, yet this marked a recovery from May’s 49.4 and was the highest since May 2024, buoyed by increased output, although new orders and foreign sales continued to decline due to newly imposed U.S. tariffs.
Figure 6: Excessive investor pessimism is showing signs of reversing from lows.
Switzerland: The Swiss model composite’s technical indicators remain negative on balance, though oversold conditions are starting to show up. Trend, price momentum, interest rate trends, and investor outflows are negative. We are underweight.
Commentary: In June 2025, the Swiss National Bank (SNB) implemented an anticipated 25 basis point cut to its policy rate, bringing it to 0%. This marks the first instance of zero borrowing costs since the negative rates instituted in late 2022. The decision comes in light of diminishing inflationary pressures, with consumer prices in Switzerland declining by 0.1% in May—the first drop in four years—attributed chiefly to reduced costs in tourism and oil products. The SNB’s inflation forecasts now stand at an average of 0.2% for 2025, rising to 0.5% in 2026 and 0.7% in 2027. Swiss GDP demonstrated robust growth in the first quarter of 2025, bolstered by early exports to the U.S. prior to impending tariffs. Although the growth momentum is projected to moderate, GDP expansion is estimated to be between 1% and 1.5% for both 2025 and 2026. The global economic outlook remains challenging due to escalating trade tensions, which introduce additional uncertainties for Switzerland’s trade environment. Furthermore, the Swiss Manufacturing PMI surged to 49.6 in June, a significant recovery from May’s 42.1, indicating a near stabilization in the manufacturing sector despite remaining below the expansion threshold for the 30th consecutive month.
Figure 7: Relative valuation measures are negative for Switzerland.
United Kingdom: The UK composite model remains negative, with measures of short-term trend, relative currency strength, valuations, and U.K. credit spreads (OAS) bearish. Investor sentiment is showing some optimism, but it is at levels that indicate a potential reversal may be at hand. We remain underweight.
Commentary: At its June meeting, the Bank of England decided to maintain the Bank Rate at 4.25%, with a 6-3 voting split. While three members advocated for a 0.25 percentage point cut to 4%, market expectations anticipated a wider 7-2 divide. The central bank highlighted that consumer price inflation is expected to stabilize at current levels for the remainder of the year before gradually approaching targets in the following year. It expressed concerns about inflationary risks tied to rising energy prices due to the ongoing conflict in the Middle East as well as potential trade disruptions from proposed US tariffs. Despite noting weak underlying UK GDP growth and a loosening labor market, the Bank emphasized a cautious approach to further monetary policy adjustments. In manufacturing, the S&P Global UK Manufacturing PMI increased to 47.7 in June 2025, indicating the smallest contraction in the sector since January. Meanwhile, the S&P Global UK Services PMI was revised upward to 52.8, reflecting a robust expansion in services prompted by improved order books and domestic demand, although employment continues to decline amid rising costs. Input cost inflation eased for the second consecutive month, leading to the weakest increase in prices charged in nearly four-and-a-half years.
Figure 8: U.K. investor sentiment back to levels denoting pessimism.
Emerging Market Positions
Approximately 30% of the strategy is allocated across five markets from a pool of more than 20 smaller markets. Selection is based on a multifactor technical ranking system using trend and mean reversion indicators. The process seeks to identify oversold opportunities within the global equity markets that are likely to mean-revert from lower levels and exhibit mild pullbacks from long-term uptrends.
Current Holdings:
Philippines
Chile
Sweden
Poland
Singapore
Explore: Emerging Market Commentary
Philippines: During its June 2025 policy meeting, the Central Bank of the Philippines reduced its benchmark interest rate by 25 basis points to 5.25%, marking the lowest level in two and a half years. This decision aligns with market expectations and reflects a more tempered inflation outlook, as noted by BSP Governor Eli Remolona, who emphasized the need to foster growth through a more accommodative monetary policy. Meanwhile, the Business Confidence Index in the Philippines fell to 28.8 in the second quarter of 2025, down from 31.2 in the previous quarter, representing the lowest point since late 2022. This decline is primarily attributed to concerns regarding a 17% reciprocal tariff on Philippine exports to the U.S. Nonetheless, as clarity surrounding the tariffs improves, the equity index is expected to respond positively.
Chile: The Central Bank of Chile maintained the monetary policy rate at 5% in response to a challenging global landscape characterized by ongoing trade tensions, slowing growth in the U.S., and escalating geopolitical risks in the Middle East. Although financial markets showed signs of stabilization and copper prices increased, oil prices spiked due to conflict-related developments. Domestically, the first-quarter economic performance exceeded forecasts, driven by robust exports and resilient services; however, the labor market remains challenged by slow job growth and rising unemployment. Inflation rates have eased, with a headline CPI at 4.4% and core CPI at 3.6% as of May. The central bank indicated that, if current trends persist, a gradual return to the neutral policy rate is expected in the upcoming quarters.
Sweden: In June, the Swedish Riksbank cut its policy rate by 25 basis points to 2%, aligning with expectations amid slowing economic recovery and easing inflation. Recent data indicate weakened growth and high unemployment, with inflation slightly below earlier forecasts, due to a decline in demand. This rate reduction aims to stabilize inflation and bolster the economy, with the possibility of further cuts this year. Global uncertainties, including trade tensions and the Middle East conflict, continue to pose significant risks. Domestically, rising real wages offer limited support as the recovery pace lags. In manufacturing, the PMI dropped to 51.90 in June from 53.10 in May 2025. In contrast, the Services PMI rose to 54.6 in June from a revised 50.9 in May, indicating stronger expansion driven by increased new orders and business volume.
Poland: The National Bank of Poland (NBP) lowered its benchmark interest rate by 25 basis points to 5.00% during its meeting on July 1-2, contrary to market expectations for a rate hold. The Lombard rate was reduced to 5.50%, and the deposit rate to 4.50%. This decision stemmed from updated forecasts indicating a decrease in inflation and GDP growth, with June’s consumer price index rising slightly to 4.1%, above the 3.5% target. Easing Middle Eastern tensions contributed to lower oil prices, which in turn bolstered the zloty against both the euro and the dollar. The index has increased by 5.31% over the past month and 20.91% year-over-year (as of July 3).
Singapore: The Monetary Authority of Singapore (MAS) has once again eased its monetary policy, marking the second consecutive reduction following January’s adjustments—the first changes since 2020. This decision comes in response to weaker-than-anticipated economic growth of 3.8% and a declining global economic outlook. MAS announced that it will maintain a gradual appreciation of the Singapore dollar nominal effective exchange rate (S$NEER) band, though at a reduced pace, while the width and center of the band remain unchanged. The central bank anticipates a negative output gap for Singapore and projects core inflation to remain below 2%. Consequently, MAS has revised its 2025 core inflation forecast to 0.5%-1.5%, down from 1.0%-2.0%, and its headline inflation forecast to 0.5%-1.5%, from 1.5%-2.5%. In June, Singapore’s Manufacturing PMI rose to 50, indicating a return to growth, driven by increased new orders and export activities.
Catastrophic Stop Model
The Catastrophic Stop model combines time-tested, objective indicators designed to identify high-risk periods for the equity market. The model entered July recommending a fully invested equity allocation relative to the benchmark.
The Day Hagan Catastrophic Stop model level is 77.27%. The model indicates that investors should maintain their benchmark equity exposure.
Measures evaluating recent breadth thrusts, oversold mean reversion probabilities, investor sentiment, longer-term trends, volume-adjusted supply versus demand, relative stock versus bond trends, credit spreads, and economic activity are supportive. We note that several indicators are positioned to shift to sell signals should upside momentum start to fade.
The weight of the evidence suggests that the recent decline is not expected to extend into a significant downtrend. Of course, if our model flips negative (below 40% for two consecutive days), signaling more substantial problems, we will raise cash immediately.
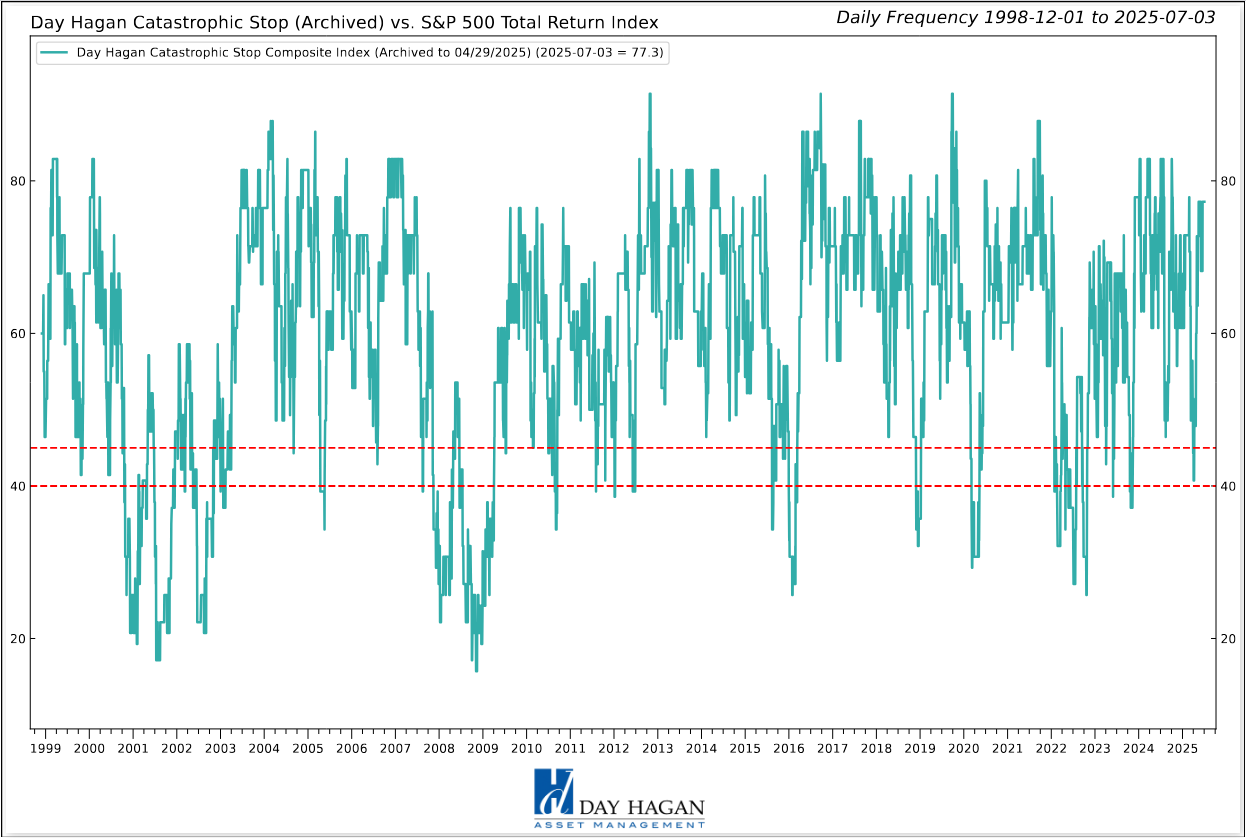
Figure 9: The Catastrophic Stop model recommends a fully invested equity position (relative to the benchmark). Due to the use of indices to extend model history, the model is considered hypothetical.
The Day Hagan Daily Market Sentiment Composite has moved further into the excessive optimism zone. This is not unusual after significant declines; historically, the model has often shown extreme pessimism that quickly transitions into excessive optimism. We interpret this rapid movement similarly to a “breadth thrust.” With sentiment indicators, we go with the flow until it reaches an extreme and reverses. In other words, we will rate this indicator as neutral until it reverses back below 70.
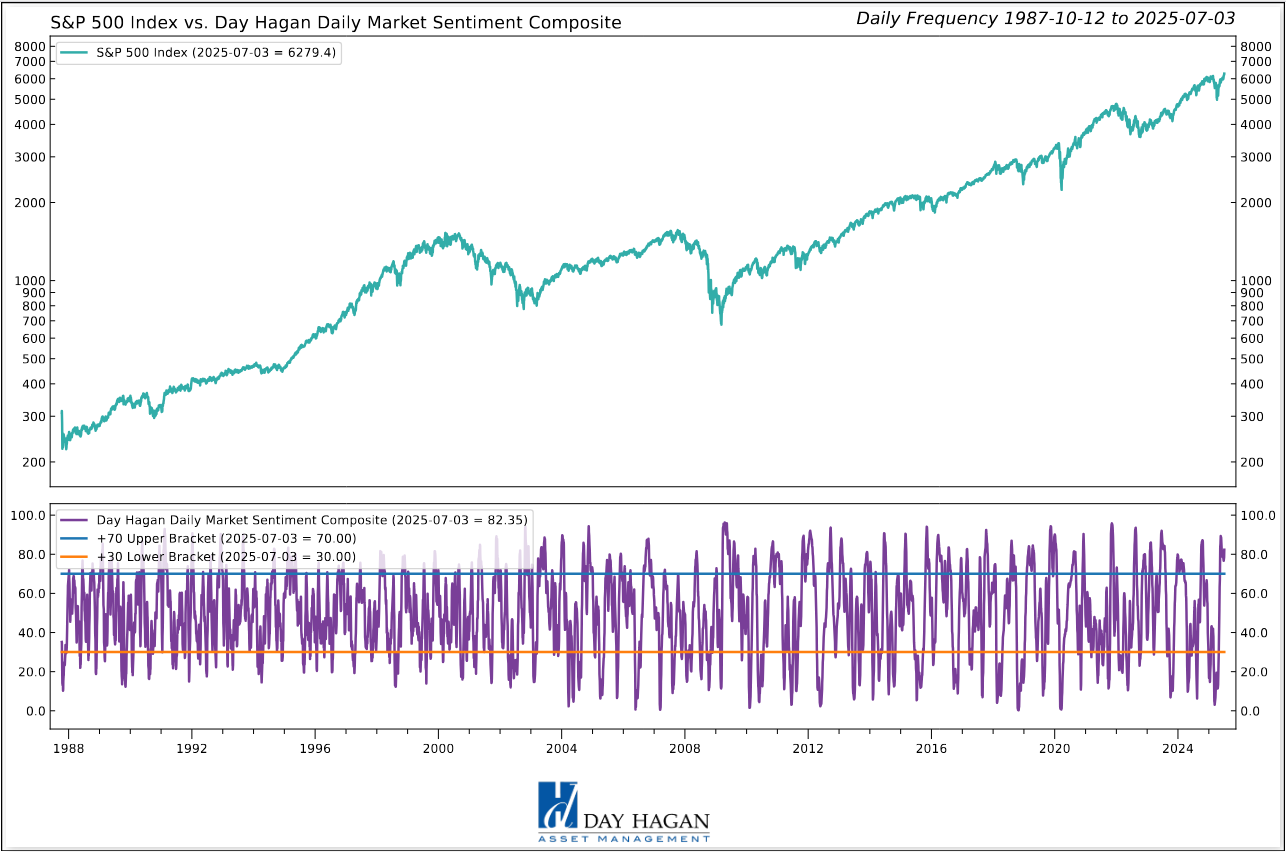
Figure 10: S&P 500 Index vs. Day Hagan Daily Market Sentiment Composite
This strategy utilizes measures of price, valuation, economic trends, monetary liquidity, and market sentiment to make objective, rational, and unemotional decisions about how much capital to place at risk and where to allocate that capital.
For more information, please contact us at:
Day Hagan Asset Management
1000 S. Tamiami Trl
Sarasota, FL 34236
Toll Free: (800) 594-7930
Office Phone: (941) 330-1702
Website: https://dayhagan.com or https://dhfunds.com
© 2025 Day Hagan Asset Management
This material is for educational purposes only. Further distribution is prohibited without prior permission. Please see the information on Disclosures and Fact Sheets here: https://dhfunds.com/literature. Charts with models and return information use indices for performance testing to extend the model histories, and they should be considered hypothetical. All Rights Reserved. (© Copyright 2025 Day Hagan Asset Management.)
Day Hagan Smart Sector® International ETF
Symbol: SSXU
Strategy Description
The Smart Sector® International strategy combines three quantitative investment strategies: Core International, Explore International, and Catastrophic Stop.
The Process Is Based On The Weight Of The Evidence
Core Allocation
The fund begins by overweighting and underweighting the largest non-U.S. equity markets based on proprietary models.
Each of the models utilizes market-specific, weight-of-the-evidence composites of fundamental, economic, technical, and behavioral indicators to determine each area’s probability of outperforming the ACWI, for example. U.S. Markets are weighted accordingly relative to benchmark weightings.
Explore Allocation
To select smaller markets, the fund uses a multi-factor technical ranking system to choose the top markets. The markets with the highest rankings split the non-core model allocation equally.
When Market Risks Become Extraordinarily High — Reduce Your Portfolio Risk
The model remains fully invested unless the Catastrophic model is triggered, whereupon the equity-invested position may be trimmed by up to 50%.
The Catastrophic Stop model combines time-tested, objective indicators designed to identify periods of high risk for the broad U.S. equity market. The model uses price-based, breadth, deviation from trend, fundamental, economic, interest rate, behavioral, and volatility-based indicator composites.
When Market Risks Return To Normal — Put Your Money Back To Work
When the Catastrophic Stop model moves back to bullish levels, indicating lower risk, the strategy will reverse toward being fully invested.
Disclosures
The data and analysis contained within are provided "as is" and without warranty of any kind, either express or implied. The information is based on data believed to be reliable, but it is not guaranteed. Day Hagan DISCLAIMS ANY AND ALL EXPRESS OR IMPLIED WARRANTIES, INCLUDING, BUT NOT LIMITED TO, ANY WARRANTIES OF MERCHANTABILITY, SUITABILITY, OR FITNESS FOR A PARTICULAR PURPOSE OR USE. All performance measures do not reflect tax consequences, execution, commissions, and other trading costs, and as such, investors should consult their tax advisors before making investment decisions, as well as realize that the past performance and results of the model are not a guarantee of future results. The Smart Sector® Strategy is not intended to be the primary basis for investment decisions and the usage of the model does not address the suitability of any particular in Fixed Income vestment for any particular investor.
Using any graph, chart, formula, model, or other device to assist in deciding which securities to trade or when to trade them presents many difficulties and their effectiveness has significant limitations, including that prior patterns may not repeat themselves continuously or on any particular occasion. In addition, market participants using such devices can impact the market in a way that changes the effectiveness of such devices. Day Hagan believes no individual graph, chart, formula, model, or other device should be used as the sole basis for any investment decision and suggests that all market participants consider differing viewpoints and use a weight-of-the-evidence approach that fits their investment needs.
Past performance does not guarantee future results. No current or prospective client should assume future performance of any specific investment or strategy will be profitable or equal to past performance levels. All investment strategies have the potential for profit or loss. Changes in investment strategies, contributions or withdrawals and economic conditions may materially alter the performance of your portfolio. Different types of investments involve varying degrees of risk, and there can be no assurance that any specific investment or strategy will be suitable or profitable for a client’s portfolio. Historical performance results for investment indexes and/or categories generally do not reflect the deduction of transaction and/or custodial charges or the deduction of an investment management fee, the incurrence of which would have the effect of decreasing historical performance results. There can be no assurances that a portfolio will match or outperform any particular benchmark.
Day Hagan Asset Management is registered as an investment adviser with the United States Securities and Exchange Commission. SEC registration does not constitute an endorsement of the firm by the Commission nor does it indicate that the adviser has attained a particular level of skill or ability.
There may be a potential tax implication with a rebalancing strategy. Re-balancing involves selling some positions and buying others, and this activity results in realized gains and losses for the positions that are sold. The performance calculations do not reflect the impact that paying taxes would have, and for taxable accounts, any taxable gains would reduce the performance on an after-tax basis. This reduction could be material to the overall performance of an actual trading account. Day Hagan does not provide legal, tax or accounting advice. Please consult your tax advisor in connection with this material, before implementing such a strategy, and prior to any withdrawals that you make from your portfolio.
There is no guarantee that any investment strategy will achieve its objectives, generate dividends or avoid losses.
© 2025 Day Hagan Asset Management
