
Day Hagan Smart Sector® International Strategy Update February 2025
A downloadable PDF copy of the Article:
Day Hagan Smart Sector® International Strategy Update February 2025 (pdf)
Catastrophic Stop Update
The Catastrophic Stop model combines time-tested, objective indicators designed to identify high-risk periods for the equity market. The model (Figure 1) improved in January and entered February with a fully invested equity allocation recommendation. We will raise cash if our models shift to bearish levels (below 40% for two consecutive days).
Figure 1: Catastrophic Stop Model vs. S&P 500 Total Return Index
Figure 2: The Global Composite Purchasing Managers’ Index (PMI) remains in expansion territory; however, manufacturing sectors continue to underperform relative to services. According to the OECD’s GDP growth projections, advanced economies are expected to grow at rates of 1.3% in both 2025 and 2026. In contrast, emerging markets are projected to achieve growth rates of 3.2% and 3.3% during the same period. Overall, global GDP is anticipated to increase by 2.9% in 2025 and 2.8% in 2026. This economic landscape provides a favorable environment for international equities.
January began with a strong U.S. jobs report, showing an unexpected increase of 256,000 jobs in December, far exceeding the analyst expectations of 160,000 jobs. This data reinforced expectations that the Federal Reserve might maintain or even elevate interest rates longer than previously anticipated, leading to an increase in U.S. Treasury yields. Specifically, the yield on the 10-year U.S. Treasury note rose by 0.17 percentage points for the week ending January 10, highlighting heightened concerns about inflation and reduced likelihood of immediate rate cuts by the Fed.
The global bond market also felt pressure, with UK government bonds (gilts) seeing a sharp sell-off. This pushed the 10-year gilt yield up, marking one of the largest one-week increases in a year. This was partly due to investor worries over the UK’s borrowing needs and the broader implications of global inflationary pressures.
The U.S. dollar’s strength, hitting a two-year high following the robust U.S. labor market data, added another layer of complexity for global stocks, particularly for companies in countries that rely heavily on U.S. markets for revenue. This was evidenced by the euro dropping significantly against the dollar, reaching its lowest level since November 2022. The anticipation of policy shifts, including potential tariffs and changes in immigration policy under President Trump, introduced further uncertainty, contributing to market volatility. Analysts noted a growing disconnect between stock performance and interest rate expectations. U.S. 10-year Treasury yields climbed above 4.5% by late January, suggesting a challenging environment for equities if bond yields were to rise further.
Overall, these factors combined to create a volatile start to the year for global stocks and bonds, with investors recalibrating their expectations amidst strong U.S. economic data, rising global yields, and policy uncertainty.
We are monitoring the following developments:
Concerns Over Chinese AI Developments: There was a notable market reaction to news regarding the competitive threat from China’s advancements in artificial intelligence. Specifically, the Chinese startup DeepSeek released an AI model that appeared to compete effectively with leading U.S. models at a lower cost, causing investors to question the high valuations of U.S. tech stocks, particularly in the AI sector. This led to a significant sell-off in tech stocks like Nvidia, Amazon, and Apple, with Nvidia experiencing its largest intraday drop since a tech rout in August of the previous year. So far, the effect appears relatively muted.
U.S. Economic Sentiment: The University of Michigan’s Consumer Sentiment Index dropped to 71.1 for January, lower than expected and down from December’s 74. This further fuels concerns about an economic slowdown and potentially affects investor confidence.
Global Market Sentiment and Policy Uncertainty: Donald Trump’s return to the White House had initially spurred U.S. stocks to new highs, but investors shifted their focus to the Federal Reserve’s policy meeting, leading to profit-taking and market corrections. The uncertainty around Trump’s pro-business policies, particularly threats of imposing higher tariffs, added to investor caution.
Trade Tensions and Tariffs: The imposition of tariffs, particularly those announced by U.S. President Donald Trump, such as a 25% tariff on Mexican and Canadian goods and an additional 10% on Chinese products, can lead to increased market volatility. These measures can disrupt trade flows, increase business costs, and potentially lead to retaliatory actions, which could heighten inflation in the U.S. and slow global economic growth. For instance, the recent announcements have already caused a flight to safety, elevating U.S. dollar and gold prices while depressing European equities.
Regional Conflicts: Ongoing and escalating conflicts, like the Russia-Ukraine war and tensions in the Middle East (Israel-Hamas, Iran, Lebanon), directly impact markets through disruptions in supply chains, particularly for commodities like oil and gas. These conflicts can lead to increased volatility in commodity prices, affecting industries dependent on these resources. Additionally, the war in Ukraine has notably influenced global equity markets’ returns and volatility, with effects more pronounced in countries with high reliance on Russian energy or those geographically close to the conflict zone.
Geopolitical Realignment: The shifting alliances and the rise of new geopolitical blocs, like the expanded BRICS+, could lead to a more fragmented global market, potentially diminishing the dominance of traditional reserve currencies like the U.S. dollar. This realignment might also affect foreign direct investment as capital flows are redirected along geopolitical lines, impacting emerging markets’ integration into global finance.
Geopolitical Risk Indices: The increasing frequency and intensity of geopolitical risks are reflected in indices like the Geopolitical Risk Index (GPR), which has shown spikes during significant events. High GPR values correlate with lower equity returns, higher market volatility, and increased investor caution, affecting both developed and emerging markets.
Core: Developed Market Positions (approximately 65% of equity holdings)
Country
Australia
Canada
China
France
Germany
Japan
Switzerland
United Kingdom
Outlook
Underweight
Overweight
Underweight
Underweight
Overweight
Modest Overweight
Overweight
Neutral
Explore: Emerging Market Positions (approximately 35% of equity holdings)
India
Taiwan
Thailand
Italy
Malaysia
Core: Developed Market Commentary
Approximately 65% of the strategy is allocated across eight of the largest markets in the ACWI ex-U.S. Index. The fund overweights and underweights the largest non-U.S. equity markets based on macro, fundamental, behavioral, and technical indicators. Weightings are determined using the Black-Litterman framework, which seeks to reduce volatility and enhance returns.
Australia: The Reserve Bank of Australia (RBA) maintained its cash rate at 4.35% during its final meeting of 2024, marking the ninth consecutive time it has kept borrowing costs steady, in line with market expectations. The RBA noted a significant decline in headline inflation, projected to remain lower for an extended period. In contrast, underlying inflation continues to exceed the target range of 2 to 3%, expected to stabilize by 2026. Following these developments, the S&P/ASX 200 Index rose by 0.57% to close at 8,447 as optimism for an early interest rate cut grew, prompted by domestic inflation data revealing an annual drop to 2.4% in Q4, below the anticipated 2.5%. In January 2025, flash data indicated a recovery in manufacturing activity, with the S&P Global Australia Manufacturing PMI climbing to 49.8 from 47.8, ending a streak of contractions. However, the Services PMI Business Activity Index dipped to 50.4, highlighting a slowdown despite ongoing expansion. We are underweight.

Figure 3: The Pacific ex-Japan region’s earnings yield is relatively high, meaning there may be some valuation-based opportunities ahead. Nonetheless, we need model confirmation that the trend has turned before adding exposure.
Canada: In January 2025, the Bank of Canada reduced its key interest rate by 25 basis points to 3%, aligning with market expectations. This adjustment marked a total of 200 basis points in rate cuts since the beginning of the easing cycle that started in June 2024. In conjunction with this decision, the central bank announced the conclusion of quantitative tightening and plans to resume asset purchases in early March to enhance liquidity and stimulate economic activity. The Governing Council highlighted a recent convergence of CPI inflation to the 2% target, which is anticipated to remain stable over the next couple of years as underlying price growth slows. However, they expressed concerns regarding tariffs from the U.S., which could challenge Canada’s economic recovery by affecting domestic demand. Despite these challenges, the Bank of Canada is optimistic about GDP growth, forecasting an expansion of 1.8% for the next two years following a 1.3% increase in 2024. The Canadian dollar fell below 1.44 against the U.S. dollar, approaching a nine-year low, as investor sentiment reacted to the rate cut and worries about U.S. tariffs intensified. Declining crude oil prices further contributed to global energy demand and economic growth concerns. The Composite model improved this month, with the aggregate technical score for the region’s companies showing that fewer stocks are stretched on the upside, the breadth of individual companies’ mean reversion moves is increasing, and Canada as a whole has the highest model level in our universe. We remain overweight.
Figure 4: Investors expect more cuts from the Bank of Canada, but not as many as just a few months ago.
China: Market sentiment remained cautious ahead of February 1, following President Donald Trump’s announcement of a 10% tariff on Chinese imports and a 25% tariff on goods from Mexico and Canada. This decision raised fears of escalating trade tensions. In addition, China’s economic landscape appeared troubling, with manufacturing activity contracting in January 2025 and a significant slowdown in services compared to December’s peak. Reacting to these challenges, the People’s Bank of China (PBoC) injected a record 1.7 trillion yuan (approximately $234 billion) into the financial system through reverse repos, underlining a commitment to yuan stability without further monetary easing, as key lending rates remained unchanged for the third month. China’s Composite model declined further with the January update, and we have moved to an underweight position. Measures of momentum, trend, economic activity, relative currency strength, and EM High-Yield credit spreads are negative. The Composite model increased this month, with EM high-yield credit spreads starting to narrow (a positive development). Measures of trend, momentum, downside volatility, economic output, and currency trends are negative. We remain underweight.

Figure 5: High-yield credit spreads are narrowing, indicating that investors are not expecting a significant financial dislocation. This is interesting, given the tariff news over the last week in January.
France: The CAC 40 rose by 0.1% to close at 7,950 on Friday, concluding January with impressive gains of 7.7%. This uptick reflected investors’ responses to economic data from Europe and corporate earnings announcements. Notably, inflation figures in Germany and France fell below expectations, indicating easing price pressures and heightening expectations for further European Central Bank (ECB) rate cuts. In France, annual inflation edged up to 1.4% in January 2025, slightly below the anticipated 1.5%, marking a fourth consecutive month of increases since the low of 1.1% in September 2024. Meanwhile, the HCOB Flash France Manufacturing PMI improved to 45.3 in January 2024, signaling the softest contraction since June, while the HCOB France Services PMI decreased to 48.9, reflecting ongoing contraction influenced by subdued demand. Despite a slowdown in the decline of new orders, job cuts in the services sector have intensified, attributed largely to the expiration of temporary contracts. The Composite model remains negative, and we remain underweight.

Figure 6: France’s leading economic indicators have reversed and are in a downtrend relative to the rest of the world.
Germany: The DAX achieved a record high in January as investors digested crucial inflation data from Europe and the U.S. alongside recent corporate earnings reports. Notably, headline inflation in Germany and France came in below expectations, hinting at reduced price pressures and supporting speculation regarding further ECB rate cuts this year. Commerzbank reported a robust 20% increase in net profit for 2024. In January 2025, Germany’s annual consumer inflation fell to 2.3%, down from 2.6% in December, while the HCOB Manufacturing PMI rose to 44.1, surpassing expectations and indicating the softest contraction since last May despite ongoing challenges from global competition and cautious consumer spending. In contrast, the HCOB Services PMI reached 52.5, signaling a six-month high and showing a slight acceleration in growth within the service sector. However, the GfK Consumer Climate Indicator decreased to -22.4, highlighting concerns about economic recovery amid rising layoffs and factory closures. The data reflects weakening expectations for economic prospects and income, in addition to an increased tendency to save as the nation approaches upcoming elections. Overall, the DAX finished January with a notable 9.2% gain, marking its best monthly performance since November 2023. We are increasing exposure as breadth improves, trend indicators are moving into buy zones, ETF inflows are accelerating, and manufacturing and services PMIs are gaining ground. We are now modestly overweight.
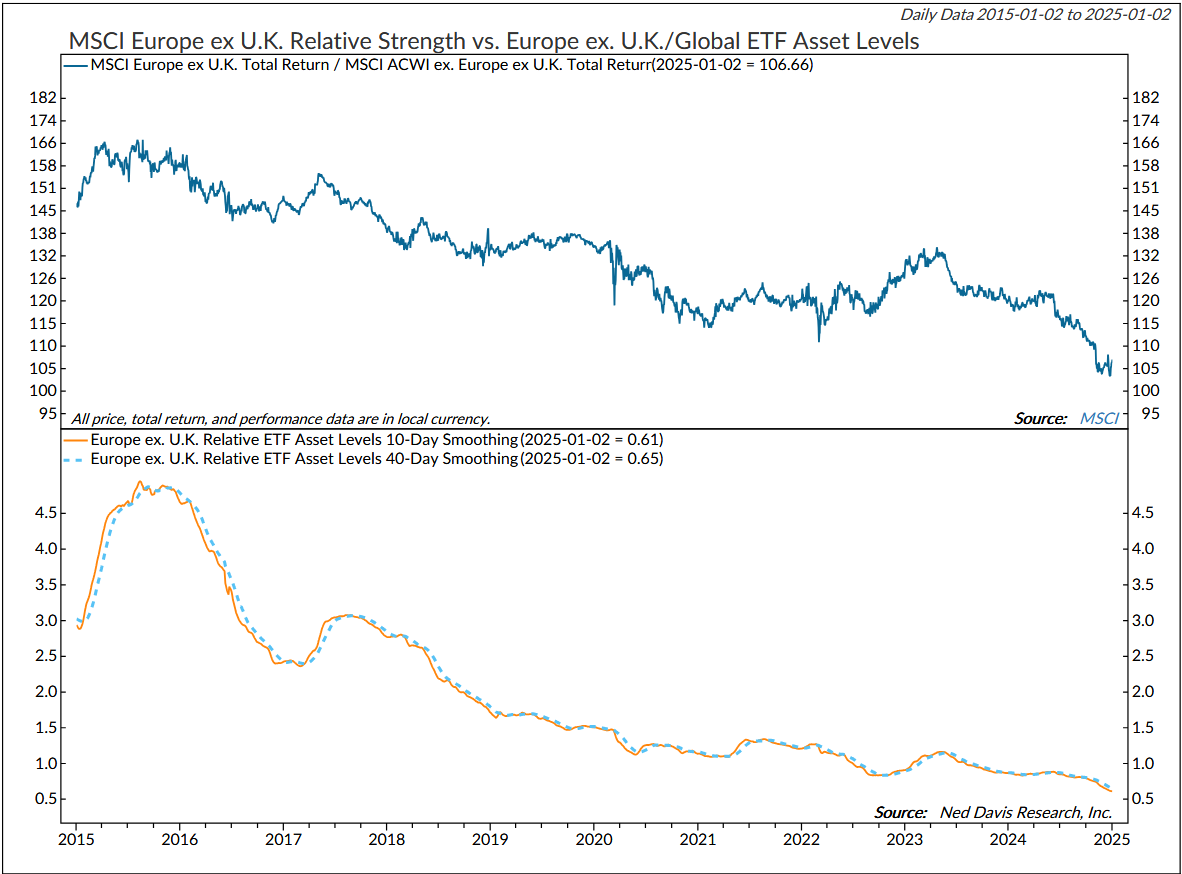
Figure 7: European bourses continue to be plagued by investor outflows (based on ETF AUM changes). Until this condition reverses, it will be difficult for the indexes to outperform their global peers.
Japan: The Bank of Japan (BoJ) opted to keep its key short-term interest rate steady at approximately 0.25% during its year-end meeting, marking the highest rate since 2008 and aligning with market expectations. Despite signs of weakness in some sectors, the BoJ continues to view Japan’s economy as undergoing a moderate recovery. Private consumption has been rising, supported by improved corporate profits and increased business investment. However, exports and industrial output have remained relatively stagnant. Inflation, measured year-on-year, has been hovering between 2.0% and 2.5%, driven primarily by rising service costs. Inflation expectations have seen a gradual uptick, with the underlying Consumer Price Index (CPI) expected to grow incrementally. The Japanese yen strengthened recently but remains close to a five-month low as investors analyzed the latest inflation figures and the BoJ’s December Summary of Opinions. Tokyo’s inflation surged to 3% in December, up from 2.6% in November, bolstering speculation around the bank’s potential interest rate increase. Moreover, the au Jibun Bank’s Japan Manufacturing PMI rose slightly to 49.5 in December, indicating a continued contraction in factory activity for six consecutive months. In contrast, the Services PMI improved to 51.4, reflecting growth in the service sector for the second straight month. Japan’s composite model improved and is now the second-highest ranked. Measures of trend and sentiment are reversing from overly pessimistic levels. We are adding again this month and are now overweight.
Figure 8: Sentiment has reversed from overly pessimistic levels, and optimism is building.
Switzerland: In December 2024, the Swiss National Bank (SNB) surprised markets by cutting its key policy rate by 50 basis points to 0.5%, surpassing expectations of a smaller 25 basis point reduction. This marks the fourth consecutive rate cut and the largest since January 2015, reducing borrowing costs to levels not seen since November 2022. The decision follows a decline in inflation, which fell from 1.1% in August to 0.7% in November, driven by decreases in domestic service, oil, and food costs. Looking ahead, inflation is projected to average 1.1% in 2024, 0.3% in 2025, and 0.8% in 2026, remaining within the SNB’s target range. Additionally, the Swiss government plans to lift restrictions on trading Swiss shares on EU exchanges, effective May 1, 2025, potentially enhancing market activity. The KOF Economic Barometer increased to 101.6 in January, reflecting improved economic conditions across various sectors. The Composite model improved in February, with asset inflows accelerating and shorter-term technical measures improving. We remain overweight.
Figure 9: We noted last month that a reversal lower in the U.S. dollar would be bullish for the Eurozone. That occurred and we are now monitoring our indicators to see if the trend is likely to continue. Recall that at the end of December, the euro was near a two-year low and down nearly 6% in 2024 due to differing central bank expectations.
United Kingdom: The British pound traded just below a three-week high at the end of January as traders analyzed recent central bank policies and the UK’s economic outlook. The U.S. Federal Reserve held interest rates steady, adopting a cautious posture on future cuts, while the ECB, Bank of Canada, and Swedish Riksbank reduced rates by 25 basis points. Analysts anticipate the Bank of England will likely cut rates in February, although strong economic data suggests a slower pace of reductions. Meanwhile, UK finance minister Rachel Reeves unveiled plans to stimulate growth, including a third runway at Heathrow Airport, despite rising concerns over national debt sustainability. In the equities market, the FTSE 100 achieved a record, marking January as its best month since November 2022, amidst a shift away from tech stocks following China’s AI advancements. The S&P Global Flash UK Manufacturing PMI rose to 48.2, indicating continued contraction, while the Services PMI showed a slight improvement to 51.2 despite declining new orders. The region’s Composite model improved slightly but is still neutral. An increasing number of positive earnings revisions and investors’ sentiment becoming more optimistic are encouraging.

Figure 10: The U.K. Recession Probability Model indicates a low probability of recession. If the series moves above 50, it would be concerning.
Emerging Market Positions
Approximately 35% of the strategy is allocated across five markets from a pool of more than 20 smaller markets. Selection is based on a multifactor technical ranking system using trend and mean reversion indicators.
Current Holdings:
India
Taiwan
Thailand
Italy
Malaysia
Explore: Emerging Market Commentary
India: The Indian rupee recently depreciated to nearly a record low, which was set earlier in January. The decline was attributed to aggressive liquidity injections and expectations of impending rate cuts by the Reserve Bank of India (RBI). The RBI’s interventions in the foreign exchange market, aimed at stabilizing the rupee, have strained bank reserves, prompting the central bank to implement a series of cash infusions, longer-dated bond purchases, and a reduction in foreign exchange reserves. These measures have led market analysts to anticipate the RBI may begin a rate-cutting cycle in the current quarter, particularly following signs of a significant slowdown in India’s economic growth. The HSBC India Manufacturing PMI rose to 58 in January 2025, indicating the fastest sector expansion since July, fueled by increased output and new orders. In contrast, the Services PMI decreased to 56.8, reflecting the slowest growth in services activity since November 2022, marked by rising input costs and weakening sentiment among businesses due to competitive pressures.
Taiwan: In January, Taiwan’s equity index benefitted from the outstanding performance of Taiwan Semiconductor Manufacturing Co. (TSMC), which reported a remarkable 57% increase in fourth-quarter earnings, fueled by robust demand in the artificial intelligence and high-performance computing sectors. This surge positively impacted the broader market sentiment. Additionally, the rising global demand for AI-related hardware significantly benefited other Taiwanese companies, particularly Foxconn, which announced record fourth-quarter revenues due to increased orders for AI servers from major U.S. technology firms. This trend further reinforced investor confidence in Taiwan’s technology sector. However, early January also saw a market pullback as high-valued stocks, including TSMC and MediaTek, experienced declines. Analysts recommended closely observing U.S. market trends and TSMC’s performance as indicators for the market’s future direction. Adding to the complexity, the inauguration of President Donald Trump introduced uncertainties regarding potential policy shifts that could affect global trade and the technology sector, leading Taiwanese authorities to acknowledge that market uncertainty would likely become the "new normal" under the new administration. Compounding these dynamics, the Taiwan Stock Exchange was closed from January 27 to 31 in observance of the Lunar New Year holiday, resulting in a shortened trading month that potentially affected overall trading volumes.
Malaysia: In January 2025, the Central Bank of Malaysia maintained its key interest rate at 3% for the tenth consecutive meeting, aligning with market expectations. The decision reflects a commitment to fostering economic growth amid stable inflation and growth indicators. Throughout 2024, Malaysia’s economy demonstrated resilience, bolstered by strong domestic consumption, employment stability, and effective policy measures. Looking ahead, the economic outlook for 2025 remains positive, supported by the same growth drivers. With headline and core inflation averaging 1.8% in 2024, inflation is projected to stay manageable in 2025, aided by easing global costs and limited domestic demand pressures.
Italy: In January 2025, the HCOB Italy Manufacturing PMI experienced a modest increase to 46.3, up from 46.2 in December, falling short of the anticipated 46.8. This marks the tenth consecutive month of contraction, driven by ongoing weak demand. New orders declined sharply, while production slowed at a slightly reduced pace. Firms continued to reduce their input purchases to manage stock levels and further cut jobs, although at a slower rate. Meanwhile, manufacturers faced rising input costs, the highest since August 2024, prompting significant reductions in output prices to maintain competitiveness. However, optimism for growth has improved, reaching levels not seen since last August, buoyed by hopes for international stability and new clientele. In contrast, the HCOB Italy Services PMI rebounded to 50.7 in December 2024, aided by increased workloads and new customer gains.
Thailand: During its final meeting of 2024, the Bank of Thailand maintained its key interest rate at 2.25% following an unexpected 25 basis points reduction in October. This decision aligns with rising inflation and GDP growth, as the central bank focuses on long-term macro-financial stability. Inflation, although remaining below the target for most of the year, climbed to a six-month peak of 0.95% in November, nearing the lower end of the 1-3% target range. The economy expanded by 3% in Q3 2024, the highest growth since Q3 2022, largely driven by government spending and fixed investment. Looking ahead, growth is projected at 2.7% for 2024 and 2.9% for 2025, bolstered by tourism and improved electronics exports.
This strategy utilizes measures of price, valuation, economic trends, monetary liquidity, and market sentiment to make objective, unemotional, rational decisions about how much capital to place at risk and where to place that capital.
For more information, please contact us at:
Day Hagan Asset Management
1000 S. Tamiami Trl
Sarasota, FL 34236
Toll Free: (800) 594-7930
Office Phone: (941) 330-1702
Website: https://dayhagan.com or https://dhfunds.com
© 2025 Day Hagan Asset Management
Charts courtesy Ned Davis Research (NDR). © Copyright 2025 NDR, Inc. Further distribution is prohibited without prior permission. All Rights Reserved. See NDR Disclaimer at www.ndr.com/copyright.html. For data vendor disclaimers, refer to www.ndr.com/vendorinfo.
Day Hagan/Ned Davis Research
Smart Sector® International ETF
Symbol: SSXU
Strategy Description
The Smart Sector® International strategy combines three quantitative investment strategies: Core International, Explore International, and Catastrophic Stop.
The Process Is Based On The Weight Of The Evidence
Core Allocation
The fund begins by overweighting and underweighting the largest non-U.S. equity markets based on proprietary models.
Each of the models utilizes market-specific, weight-of-the-evidence composites of fundamental, economic, technical, and behavioral indicators to determine each area’s probability of outperforming the ACWI, for example. U.S. Markets are weighted accordingly relative to benchmark weightings.
Explore Allocation
To select smaller markets, the fund uses a multi-factor technical ranking system to choose the top markets. The markets with the highest rankings split the non-core model allocation equally.
When Market Risks Become Extraordinarily High — Reduce Your Portfolio Risk
The model remains fully invested unless the Catastrophic model is triggered, whereupon the equity-invested position may be trimmed by up to 50%.
The Catastrophic Stop model combines time-tested, objective indicators designed to identify periods of high risk for the broad U.S. equity market. The model uses price-based, breadth, deviation from trend, fundamental, economic, interest rate, behavioral, and volatility-based indicator composites.
When Market Risks Return To Normal — Put Your Money Back To Work
When the Catastrophic Stop model moves back to bullish levels, indicating lower risk, the strategy will reverse toward being fully invested.
Disclosures
The data and analysis contained within are provided "as is" and without warranty of any kind, either express or implied. The information is based on data believed to be reliable, but it is not guaranteed. Day Hagan DISCLAIMS ANY AND ALL EXPRESS OR IMPLIED WARRANTIES, INCLUDING, BUT NOT LIMITED TO, ANY WARRANTIES OF MERCHANTABILITY, SUITABILITY, OR FITNESS FOR A PARTICULAR PURPOSE OR USE. All performance measures do not reflect tax consequences, execution, commissions, and other trading costs, and as such, investors should consult their tax advisors before making investment decisions, as well as realize that the past performance and results of the model are not a guarantee of future results. The Smart Sector® Strategy is not intended to be the primary basis for investment decisions and the usage of the model does not address the suitability of any particular in Fixed Income vestment for any particular investor.
Using any graph, chart, formula, model, or other device to assist in deciding which securities to trade or when to trade them presents many difficulties and their effectiveness has significant limitations, including that prior patterns may not repeat themselves continuously or on any particular occasion. In addition, market participants using such devices can impact the market in a way that changes the effectiveness of such devices. Day Hagan believes no individual graph, chart, formula, model, or other device should be used as the sole basis for any investment decision and suggests that all market participants consider differing viewpoints and use a weight-of-the-evidence approach that fits their investment needs.
Past performance does not guarantee future results. No current or prospective client should assume future performance of any specific investment or strategy will be profitable or equal to past performance levels. All investment strategies have the potential for profit or loss. Changes in investment strategies, contributions or withdrawals and economic conditions may materially alter the performance of your portfolio. Different types of investments involve varying degrees of risk, and there can be no assurance that any specific investment or strategy will be suitable or profitable for a client’s portfolio. Historical performance results for investment indexes and/or categories generally do not reflect the deduction of transaction and/or custodial charges or the deduction of an investment management fee, the incurrence of which would have the effect of decreasing historical performance results. There can be no assurances that a portfolio will match or outperform any particular benchmark.
Day Hagan Asset Management is registered as an investment adviser with the United States Securities and Exchange Commission. SEC registration does not constitute an endorsement of the firm by the Commission nor does it indicate that the adviser has attained a particular level of skill or ability.
There may be a potential tax implication with a rebalancing strategy. Re-balancing involves selling some positions and buying others, and this activity results in realized gains and losses for the positions that are sold. The performance calculations do not reflect the impact that paying taxes would have, and for taxable accounts, any taxable gains would reduce the performance on an after-tax basis. This reduction could be material to the overall performance of an actual trading account. Day Hagan does not provide legal, tax or accounting advice. Please consult your tax advisor in connection with this material, before implementing such a strategy, and prior to any withdrawals that you make from your portfolio.
There is no guarantee that any investment strategy will achieve its objectives, generate dividends or avoid losses.
© 2025 Day Hagan Asset Management
