
Day Hagan Smart Sector® Fixed Income Strategy Update October 2026
A downloadable PDF copy of the Article:
Day Hagan Smart Sector® Fixed Income Strategy Update October 2026 (pdf)
Summary
Higher yields have improved the income available to bond investors. They have also raised the cost of being early. Our updated indicators favor inflation protection, floating-rate exposure and dollar-denominated emerging-market debt, while broad U.S. Aggregate bonds and long Treasuries face a less favorable signal mix.
The Federal Reserve raised its target range by 0.25 percentage point to 3.75%–4.00% on September 16th in a unanimous decision. Its statement described solid economic activity and elevated inflation. For bond investors, that shifts the discussion toward how much additional tightening the economy can absorb and whether higher yields adequately compensate for the risk.
Economic activity has not stalled. The September 30th GDP release put second-quarter real growth at a 2.2% annualized rate, following a revised 2.5% in the first quarter. August real consumer spending increased 0.6% from July, while real disposable income was unchanged. Spending strength supports business revenues, but spending that outruns income is less comfortable for household finances. The August jobs report, as originally released and available at the cutoff, showed 162,000 additional payrolls and 4.1% unemployment.
Inflation remains the constraint. August PCE inflation was 3.4% year over year, with core PCE at 3.0%. CPI also increased 3.4% over the year, although core CPI was lower at 2.4%. The distinction matters because the measures use different baskets and weights. Energy CPI rose 16.3% over the year, illustrating how energy costs can keep headline inflation elevated even when underlying inflation is lower.
We favor a measured approach to interest-rate risk and greater attention to the source of each bond’s return. Floating coupons can adjust as short rates change. Short-maturity TIPS offer a way to address inflation risk with less real-rate sensitivity than longer TIPS. Emerging-market signals remain constructive, while improving mortgage indicators suggest that the opportunity set is widening. None of these signals makes credit quality, valuation or liquidity less important.
The next useful confirmation would be broader participation in credit and firmer absolute bond trends. Better breadth would make a constructive high-yield signal more persuasive. A positive moving-average cross would strengthen the TIPS case. A recovery in mortgage relative strength would help distinguish an early improvement from a durable change.
We would also watch whether inflation pressure eases without a material weakening in borrower cash flow. An energy-driven inflation shock could pressure nominal duration and import-dependent issuers at the same time. A growth shock could favor Treasury duration while harming lower-quality credit. That is why we evaluate rates, credit and currency risks separately and combine them within a weight-of-the-evidence process.
We continue to hold last month’s relative allocations. Treasuries, short-term TIPS, floating-rate notes and international investment-grade corporates remain neutral. U.S. MBS and investment-grade corporates remain underweight. High yield and emerging-market bonds remain overweight.
Holdings
Fixed Income Sector
US 1-3 Month T-bill
US 3-7 Year Treasury
US 10-20 Year Treasury
TIPS (short-term)
US Mortgage-Backed
US Floating Rate
US Corporate
US High Yield
International Corporate Bond
Emerging Market Bond
Outlook (relative to benchmark)
Neutral
Neutral
Neutral
Neutral
Underweight
Neutral
Underweight
Overweight
Neutral
Overweight
Position Details
U.S. TREASURIES — NEUTRAL
The U.S. Treasury composite model remains mixed. Its technical cross, momentum and inflation-expectations inputs are bearish. The credit-default-swap relationship is bullish, while the equity-market-trend input is neutral. This combination supports a measure of caution when adding long duration. A higher yield improves the entry point, but it does not establish that the price decline has finished.
Treasury exposure should reflect the job each maturity is intended to do. Short maturities provide liquidity and less sensitivity to interest-rate changes. Intermediate maturities offer a middle ground between reinvestment risk and price risk. Long Treasuries can appreciate strongly when yields decline, but they can also suffer substantial losses if inflation pressure or required compensation for holding long bonds rises.
The shape of the curve does not isolate a single cause. Expected policy rates, inflation uncertainty and term premium all influence yields. Geopolitical events can also pull in opposing directions. A flight to safety may support Treasury prices, while an energy supply disruption can raise inflation concerns. We would look for improving price momentum and steadier inflation expectations before treating long duration as the strongest opportunity.
The business surveys help explain why we retain neutral Treasury exposure rather than making a larger recession bet. August’s ISM Services PMI was 55.4 and new orders reached 60.9, both above the 50 expansion threshold. Yet its employment index was 47.8, signaling contraction in that component. Demand is holding up better than hiring. That combination supports keeping government bonds as a source of liquidity and potential protection, while the unfavorable long-Treasury trend argues against an overweight. Neutral across the maturity ranges preserves exposure if growth weakens without making the portfolio overly dependent on falling long-term yields.
Figure 1. Trend and momentum indicators remain cautious.
U.S. TIPS — NEUTRAL
TIPS are supported by bullish RSI (relative strength index), commodity trend, momentum mean reversion, the high-yield-spread relationship and inflation expectation indicators. The moving-average cross remains bearish. The recent model improvement strengthens the case for maintaining inflation protection.
TIPS still carry interest-rate risk. Treasury’s five-year real par yield rose from 2.18% at August month-end to 2.73% at September month-end. The 10-year real yield increased from 2.44% to 2.93%. Those higher real yields improve prospective compensation for new buyers while explaining why inflation protection can coexist with price losses.
We retain neutral short-term TIPS exposure while acknowledging the more favorable evidence. The remaining bearish trend input and real-rate sensitivity temper the case for increasing the allocation. Inflation adjustments do not guarantee a positive fund return, and a broad TIPS signal does not remove the need to manage maturity exposure. We would want the remaining trend signal to improve before claiming complete technical confirmation.
The latest inflation figures support holding protection without assuming that price pressures will accelerate indefinitely. August headline CPI rose 0.4% from July, with gasoline up 3.9%, while core CPI rose 0.3%. Energy shocks can reach transportation, production and household budgets, but their persistence matters more than any single monthly reading. TIPS adjust with consumer inflation, yet their market value also reflects the inflation compensation already embedded in prices. We therefore retain a neutral allocation that can help if inflation proves persistent, while limiting the risk of paying too much for protection just as real yields rise.
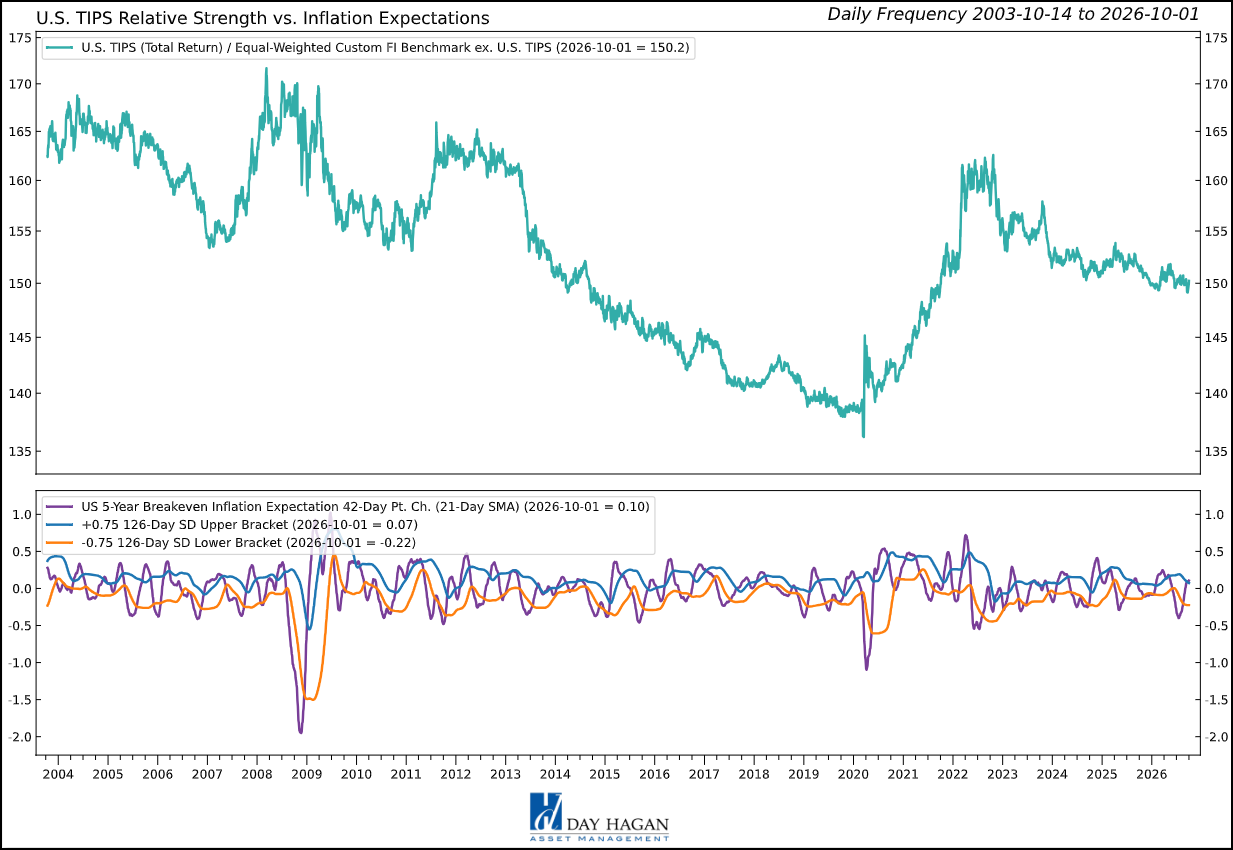
Figure 2: Firmer inflation signals justify neutral short-term TIPS exposure, while trend and real-yield risk limit conviction.
U.S. MORTGAGE-BACKED SECURITIES — UNDERWEIGHT
The Mortgage-backed securities composite model has improved. RSI, the 10-year-yield relationship, high-yield spreads and inflation expectations are bullish. The moving-average cross and relative-strength slope remain bearish.
Mortgages occupy a distinct place between Treasury duration and corporate credit. For agency MBS, the principal concerns often involve cash-flow timing, interest-rate volatility and the compensation for embedded prepayment options. Government and agency support differs by issuer and security. It should not be described as a blanket guarantee against market losses, nor should the agency discussion be applied automatically to non-agency mortgages.
When rates rise, refinancing can slow and expected repayment periods can lengthen. When rates fall, borrowers may refinance and return principal just when reinvestment yields are less attractive. That unfavorable change in cash-flow timing is why a mortgage yield must be evaluated alongside prepayment and extension risk. The improving model inputs support a fresh assessment of relative value, but the two weak trend measures argue for measured implementation rather than assuming that stabilization is complete.
Freddie Mac’s September 24 survey, the final weekly release available before month-end, put the average 30-year fixed mortgage rate at 7.03%, up from 6.95% the prior week. This is a borrower mortgage rate, not an MBS investment yield. Higher financing costs can suppress refinancing and keep older loans outstanding longer. That reinforces our concern about extension risk when rates are rising. Improved model readings make a complete retreat less compelling, but we retain the underweight until stronger price trends provide more evidence that the potential income adequately compensates for unstable repayment timing.
Figure 3: Looking for trend improvement before increasing exposure.
U.S. FLOATING RATE NOTES — NEUTRAL
Floating-rate notes retain a favorable signal mix. The technical cross, momentum, relative-strength slope and overnight-index-swap relationship are bullish. The VIX-extremes input is neutral.
The appeal is straightforward. Coupons on floating-rate instruments reset with their contractual reference rates, reducing the need to forecast the direction of long-term yields. The September policy increase makes that feature relevant, although reset frequency, reference rates, spreads, caps and floors determine how quickly and how fully income changes. A favorable rate environment does not ensure that every floating-rate security delivers the same result.
Issuer and structure matter. Treasury floating-rate notes, investment-grade corporate floaters and leveraged loans have different credit and liquidity risks. Low interest-rate duration should never be treated as low total risk. Floating-rate exposure offers less opportunity for price appreciation when yields fall, and its income can decline as reference rates reset lower. We retain neutral exposure, using the favorable signal mix to support a measured allocation while preserving flexibility if fixed-rate opportunities improve.
The allocation also reflects the difference between near-term income and the portfolio’s longer-term needs. The Fed’s September increase supports resetting coupons, but it does not establish the path of subsequent decisions. An overweight would place more income at risk of declining if policy eventually eases, while offering limited participation in a fixed-rate bond rally. Neutral keeps useful exposure to the current rate environment without allowing one policy scenario to dominate. For credit-sensitive floaters, higher coupons paid to investors also mean greater interest expense for borrowers, making repayment capacity an essential part of the assessment.
Figure 4: Floating Rate Notes momentum approaching overbought levels.
U.S. IG CORPORATE BONDS — UNDERWEIGHT
The U.S. IG Corporate composite model remains one of the weakest. Implied bond volatility, option-adjusted spreads, the dollar relationship and price mean reversion are bearish. Credit-default swaps are neutral. A recent positive technical cross is an improvement, but it is not yet supported by the broader mix of risk and valuation signals.
A broad U.S. IG Corporate universe includes government and securitized debt as well as investment-grade corporate bonds. It is therefore useful context for diversified fixed income, with corporate exposure requiring a separate assessment. Its cautious signal balance argues against adding broad exposure simply because headline yields look higher. The improving technical cross is encouraging, yet the other inputs still limit conviction.
For corporate credit, the relevant question is how much additional yield compensates for default, downgrade and liquidity risk after allowing for Treasury duration. A high all-in yield may come mainly from the government rate underneath it. New issuance can create better entry prices, but supply alone does not establish either deteriorating credit quality or attractive valuation. We favor careful assessment of refinancing needs, cash flow and maturity exposure. We retain the corporate underweight. The broad model reinforces caution, while issuer fundamentals and the spread available for taking corporate risk remain essential to the allocation decision.
The consumer data give us a reason to distinguish healthy revenue growth from durable repayment capacity. August nominal spending rose 0.9%, compared with a 0.3% increase in disposable personal income, and the personal saving rate was 4.1%.
Businesses can benefit from current demand while facing a less dependable consumer later. Higher refinancing costs can also reach corporate income statements gradually as existing debt matures. Our underweight reflects limited model confirmation and competing risks from duration and credit spreads, rather than a forecast of widespread investment-grade defaults. Stronger fundamentals alone would not eliminate the price risk of another rise in yields.
Figure 5: CDS levels rising. We’re monitoring closely.
U.S. HIGH YIELD — OVERWEIGHT
High yield remains overweight. The technical cross, VIX moving-average relationship and option-adjusted-spread reversals are bullish. Breadth, small-cap equity trend and the absolute total-return moving-average cross are bearish.
Improving spread behavior provides some support, but weak breadth means that participation is less convincing. The bearish absolute-return trend also matters. A sector can hold up better than another bond category and still deliver a negative return. We retain the high-yield overweight, but the unchanged bullish count does not mean risk is unchanged. Weak participation and absolute trend make this one of the positions requiring closer monitoring.
The economic data available at month-end offer support for issuer revenues, while higher refinancing costs remain a potential drag. A simultaneous recovery in breadth and absolute trend would strengthen the case. Further deterioration would reduce confidence even if spreads initially appear stable. Income can absorb some price volatility, but it cannot be assumed to offset a sustained credit downturn.
The case for retaining the overweight rests on continued demand and the favorable technical-cross, volatility and spread-reversal inputs. The services survey’s strong orders support the revenue outlook, but its prices index of 72.6 points to widespread input-cost increases (not a 72.6% inflation rate).
Issuers need enough pricing power and cash flow to absorb those costs. We judge the expansion backdrop sufficient to retain the position, while the weak breadth and absolute trend limit our conviction. A deterioration in demand combined with further weakness in those market measures would challenge the overweight more directly than higher Treasury yields alone.
Figure 6: Long-term uptrend intact.
INTERNATIONAL IG CORPORATE BONDS — NEUTRAL
The International IG Corporate Bond composite remains neutral. Relative-strength slope and the moving-average cross are bullish. Equity risk/VIX and option-adjusted spreads are bearish, while credit-default swaps are neutral.
International diversification also requires separating local bond returns from currency returns. For an unhedged U.S. investor, currency appreciation can add to a local bond gain, while depreciation can reduce or reverse it. Hedging changes that exposure but carries costs and may be imperfect. Diverging central-bank decisions, energy import dependence and fiscal borrowing needs can influence local yields differently.
The mixed broad model supports measured sizing and explicit attention to currency risk, while the corporate sleeve still requires its own credit assessment.
Policy developments argue against assuming that overseas bonds offer a simple escape from U.S. rate pressure. The ECB raised its deposit rate by 0.25 percentage point to 2.50% in September, citing inflation pressure from the Middle East conflict. The Bank of England held at 3.75% by a 6–3 vote, with the minority favoring a rise to 4.00%. The decisions differ, but both show attention to inflation risk. Neutral exposure retains issuer and regional diversification while avoiding an aggressive bet on foreign policy easing. Energy-sensitive margins, local refinancing costs and currency movements remain important reasons to demand stronger confirmation before increasing the allocation.
Figure 7: CDS rates also increasing internationally.
EMERGING MARKET BONDS — OVERWEIGHT
Emerging-market (dollar denominated) bonds remain among the more constructive areas based on indicator support. The currency indicators, emerging-equity momentum, commodity strength and relative-strength slope are bullish. The absolute moving-average cross is bearish.
Dollar denomination removes direct local-currency translation from the bond’s contractual payments for a dollar-based investor. It does not remove the issuer’s exposure to exchange rates. A government or company earning local currency may find dollar debt harder to service when its currency weakens. Reserves, external funding needs and the maturity schedule therefore matter alongside the coupon.
Commodity exposure also varies substantially across issuers. An energy price shock may help an exporter’s revenues while worsening an importer’s inflation and external balance. The bullish commodity input is a model relationship, not evidence that every emerging borrower benefits. We favor diversification and attention to repayment capacity, while watching for a stronger dollar, higher U.S. real yields or weaker commodity demand to undermine the current support.
The broader growth outlook provides qualified support. In its July forecast, the IMF projected emerging-market and developing-economy growth of 3.8% in 2026 and 4.5% in 2027. Those are forecasts for a broad country group, not growth estimates for this portfolio or guarantees of bond returns. They nevertheless provide context for retaining exposure to borrowers operating in expanding economies. We keep the overweight because that backdrop is accompanied by favorable currency, equity, commodity and relative-strength model relationships. Country differences remain critical, and the position would be less persuasive if dollar funding pressure increased while those supporting relationships weakened.
Figure 8: Strength in the commodity markets is generally positive for EM bonds.
Catastrophic Stop Model
The Catastrophic Stop model combines time-tested, objective indicators to identify high-risk periods for equities and fixed-income assets that are highly correlated with the equity market. The model entered October recommending a fully invested allocation relative to the benchmark for equity-sensitive credit sectors.
The current reading indicates that recent equity weakness is not yet consistent with a significant downtrend. If the model falls below 40% for two consecutive days, it would trigger a sell signal and the strategy would reduce exposure. The model can respond to changing conditions, but no signal can eliminate loss or identify every market turning point.
Figure 9: The Catastrophic Stop model recommends a fully invested position relative to the benchmark. Because the model uses indices to extend its history, the historical illustration is considered hypothetical.
Hypothetical and historical past performance is not indicative of future results. There can be no assurance that any investment or strategy will achieve its objectives or avoid substantial losses or have comparable results. This information is provided for illustrative purposes only and is not a prediction, projection, or guarantee of future performance. Hypothetical results do not reflect actual trading, were derived using the benefit of hindsight, and may not reflect material economic and market events. Actual results vary and depend on many factors and subject to risk and uncertainties.
Our goal is to participate while the prevailing trend is constructive and to reduce equity-sensitive credit exposure when conditions deteriorate. The Catastrophic Stop model is currently positive, while the sector composites remain differentiated: strongest in floating-rate and emerging-market bonds, balanced in high yield and global bonds, and weakest in the broad U.S. Aggregate and long Treasuries. The portfolio is aligned with that message.
This strategy uses price, valuation, economic, liquidity, and sentiment measures to make objective allocation decisions. Model signals are inputs, not guarantees. They may change without notice, and there is no assurance that an overweight will outperform, an underweight will reduce loss, or the Catastrophic Stop model will avoid a market decline.
For more information, please contact us at:
Day Hagan Asset Management
1000 S. Tamiami Trl
Sarasota, FL 34236
Toll Free: (800) 594-7930
Office Phone: (941) 330-1702
Website: https://dayhagan.com or https://dhfunds.com
© 2026 Day Hagan Asset Management
This material is for educational purposes only. Further distribution is prohibited without prior permission. Please see the information on Disclosures and Fact Sheets here: https://dhfunds.com/literature. Charts with models and return information use indices for performance testing to extend the model histories, and they should be considered hypothetical. All Rights Reserved.
Day Hagan Smart Sector® Fixed Income ETF
Symbol: SSFI
Disclosures
The data and analysis contained within are provided “as is” and without warranty of any kind, either express or implied. The information is based on data believed to be reliable, but it is not guaranteed. Day Hagan DISCLAIMS ANY AND ALL EXPRESS OR IMPLIED WARRANTIES, INCLUDING, BUT NOT LIMITED TO, ANY WARRANTIES OF MERCHANTABILITY, SUITABILITY, OR FITNESS FOR A PARTICULAR PURPOSE OR USE. All performance measures do not reflect tax consequences, execution, commissions, and other trading costs, and as such, investors should consult their tax advisors before making investment decisions, as well as realize that the past performance and results of the model are not a guarantee of future results. The Smart Sector® Strategy is not intended to be the primary basis for investment decisions, and the usage of the model does not address the suitability of any particular investment for any particular investor.
Using any graph, chart, formula, model, or other device to assist in deciding which securities to trade or when to trade them presents many difficulties, and their effectiveness has significant limitations, including that prior patterns may not repeat themselves continuously or on any particular occasion. In addition, market participants using such devices can impact the market in a way that changes the effectiveness of such devices. Day Hagan believes no individual graph, chart, formula, model, or other device should be used as the sole basis for any investment decision and suggests that all market participants consider differing viewpoints and use a weight-of-the-evidence approach that fits their investment needs.
Past performance does not guarantee future results. No current or prospective client should assume future performance of any specific investment or strategy will be profitable or equal to past performance levels. All investment strategies have the potential for profit or loss. Changes in investment strategies, contributions or withdrawals, and economic conditions may materially alter the performance of your portfolio. Different types of investments involve varying degrees of risk, and there can be no assurance that any specific investment or strategy will be suitable or profitable for a client’s portfolio. Historical performance results for investment indexes and/or categories generally do not reflect the deduction of transaction and/or custodial charges or the deduction of an investment management fee, the incurrence of which would have the effect of decreasing historical performance results. There can be no assurances that a portfolio will match or outperform any particular benchmark. Comparisons to indices are inherently unreliable indicators of future performance. The strategies used to generate the performance vary from those used to generate the returns depicted in the benchmarks. Investors cannot directly invest in an index.
The information contained herein is provided for informational purposes only and should not be construed as investment advice or a recommendation to buy or sell any security. The securities, instruments, or strategies described may not be suitable for all investors, and their value and income may fluctuate. Past performance is not indicative of future results, and there is no guarantee that any investment strategy will achieve its objectives, generate profits, or avoid losses.
This material is intended to provide general market commentary and should not be relied upon as individualized investment advice. Investors should consult with their financial professional before making any investment decisions based on this information.
The material may contain “forward-looking” information that is not purely historical in nature. Such information may include, among other things, projections, forecasts, estimates of market returns, and proposed or expected portfolio composition. Day Hagan Asset Management, its affiliates, employees, or third-party data providers shall not be liable for any loss sustained by any person relying on this information. All opinions and views expressed are subject to change without notice and may differ from those of other investment professionals within Day Hagan Asset Management or Ashton Thomas Private Wealth, LLC.
Accounts managed by Day Hagan Asset Management or its affiliates may hold positions in the securities discussed and may trade such securities without notice.
Day Hagan Asset Management is a division of and doing business as (DBA) Ashton Thomas Private Wealth, LLC, an SEC-registered investment adviser. Registration with the SEC does not imply a certain level of skill or training.
This material is for educational purposes only. Further distribution is prohibited without prior permission. Please see the information on Disclosures and Fact Sheets here: https://dhfunds.com/literature. Charts with models and return information use indices for performance testing to extend the model histories, and they should be considered hypothetical. All Rights Reserved.
All hypothetical results are presented for illustrative purposes only. Back testing and other statistical analysis is provided in use simulated analysis and hypothetical circumstances to estimate how it may have performed prior to its actual existence. The results obtained from "back-testing" information should not be considered indicative of the actual results that might be obtained from an investment or participation in a financial instrument or transaction referencing the Index. The Firm provides no assurance or guarantee that the products/securities linked to the strategy will operate or would have operated in the past in a manner consistent with these materials. The hypothetical historical levels have inherent limitations. Alternative simulations, techniques, modeling or assumptions might produce significantly different results and prove to be more appropriate. Actual results will vary, perhaps materially, from the simulated returns presented.
© 2026 Day Hagan Asset Management
Disclosure
Federal Reserve (Fed) — The central bank of the United States, responsible for setting monetary policy and short-term interest rates.
U.S. Treasuries — Bonds issued by the U.S. government; they are widely used as benchmarks for interest rates and as defensive assets in portfolios.
T-bill (Treasury bill) — A short-term U.S. government security, typically maturing in one year or less.
Duration — A measure of a bond’s sensitivity to changes in interest rates; higher duration usually means greater price movement when yields change.
Yield — The income return on a bond, usually expressed as an annual percentage of its price.
Investment-Grade (IG) Corporate Bonds — Corporate bonds with relatively high credit quality and lower default risk than high-yield bonds.
High-Yield (HY) Bonds — Lower-rated corporate bonds that offer higher yields because they carry higher credit risk.
Private Credit — Non-bank lending, often directly to companies, outside the public bond markets.
TIPS (Treasury Inflation-Protected Securities) — U.S. government bonds designed to protect investors from inflation by adjusting principal based on inflation.
Breakeven Inflation Rate — The market’s implied inflation expectation, calculated as the difference between nominal Treasury yields and TIPS yields.
Real Yield — A bond yield after adjusting for inflation; often referenced in connection with TIPS.
Nominal Yield — A bond yield not adjusted for inflation.
Inflation Expectations — The market’s view of future inflation, which influences both bond yields and asset prices.
Mortgage-Backed Securities (MBS) — Bonds backed by pools of home mortgages; investors receive cash flows from underlying mortgage payments.
Agency MBS — Mortgage-backed securities issued or guaranteed by U.S. government-related agencies, generally viewed as having high credit quality.
Floating Rate Notes (FRNs) — Bonds whose interest payments reset periodically based on a short-term reference rate, reducing interest-rate sensitivity.
SOFR (Secured Overnight Financing Rate) — A key U.S. benchmark short-term interest rate used in loans, derivatives, and floating-rate instruments.
OIS (Overnight Index Swap) Rate — A rate derived from swaps tied to overnight interest rates, often used to gauge policy-rate expectations.
Primary Issuance — The sale of new bonds into the market by governments or companies.
Spread — The yield difference between one bond and a benchmark, often used to measure compensation for credit risk.
Option-Adjusted Spread (OAS) — A spread measure that adjusts for embedded bond options, commonly used in corporate bonds and mortgage-backed securities.
Credit Default Swap (CDS) — A derivative contract used to insure against bond default risk; rising CDS levels often signal greater credit concern.
Carry — The return earned from holding a bond or credit asset, assuming market conditions remain stable.
Refinancing Risk — The risk that a borrower will face higher costs or difficulty when replacing maturing debt with new debt.
Emerging Market (EM) Bonds — Debt issued by governments or companies in developing economies.
Hard-Currency Debt — Emerging-market debt issued in a major foreign currency, usually U.S. dollars or euros.
Local-Currency Debt — Emerging-market debt issued in the borrower’s domestic currency, making returns more sensitive to exchange-rate movements.
Risk-On / Risk-Off — Market environments where investors are either more willing to buy riskier assets (“risk-on”) or prefer safer assets (“risk-off”).
RSI (Relative Strength Index) — A technical indicator used to assess whether an asset may be overbought or oversold.
VIX — A widely followed measure of U.S. equity market volatility, often called the market’s “fear gauge.”