
Day Hagan Smart Sector® Fixed Income Strategy Update August 2026
A downloadable PDF copy of the Article:
Day Hagan Smart Sector® Fixed Income Strategy Update August 2026 (pdf)
Executive Summary
July reminded investors that a bond can offer attractive income and still lose ground when the market reprices inflation, policy, and supply. The 3-month Treasury bill ended the month near 3.78%, only two basis points lower than in June. Farther out, the 5-year yield rose 21 basis points to 4.45%, the 10-year climbed 26 basis points to 4.74%, and the 30-year increased 31 basis points to 5.28%. The result was a steeper yield curve and a clear message from the market. Investors wanted more compensation for committing money for longer periods.
The economic data offered support to both sides of the argument. June CPI fell 0.4% from the prior month, bringing the 12-month rate down to 3.5% from 4.2%. Core CPI was unchanged for the month and slowed to 2.6% from a year earlier. Producer prices also declined 0.3%. Those readings showed that the first surge in energy costs was fading from the monthly data. The PCE report was less comforting. Headline PCE inflation was still 3.7%, and core PCE was 3.3%, both above the Federal Reserve’s objective.
The Iran war kept the bond market from declaring victory. Brent crude finished July near $90 per barrel after rising roughly 26% during the month, while interruptions around the Strait of Hormuz and Red Sea kept the range of possible outcomes unusually wide. Market-based inflation expectations remained contained, with 5-year and 10-year breakevens near 2.26% and 2.28%. Consumer surveys were less relaxed. One-year University of Michigan inflation expectations were 4.2%. That split helps explain why inflation protection still has a purpose, but does not automatically deserve an overweight.
The Federal Reserve held the federal funds target at 3.50% to 3.75% on July 29. Three policymakers preferred a quarter-point increase, the strongest dissent of the current policy cycle. The decision did not calm the long end. Instead, yields rose as investors questioned whether the Fed would ultimately need to do more and whether large Treasury issuance would continue to push term premiums higher. The policy rate may be on hold, but financial conditions are not standing still.
Our portfolio remains built around income, credit quality, and controlled duration. U.S. 1–3 Month T-bills, 3–7 Year Treasuries, 10–20 Year Treasuries, and U.S. Floating Rate Notes are neutral. Short-term TIPS remain underweight. U.S. Mortgage-Backed Securities remain overweight. U.S. Investment-Grade Bonds and International Investment-Grade Bonds remain underweight. U.S. High Yield and Emerging-Market USD Bonds remain overweight.
The positioning is more targeted than defensive. Bills and floating-rate notes provide income without requiring a forecast that long rates will fall. Agency MBS offer high-quality spread income and a favorable indicator mix. High-yield and EM USD bonds add carry where market breadth, currencies, commodities, and issuer fundamentals still provide support. The underweights in broad U.S. and international investment-grade bonds reflect rate sensitivity, thin spread cushions, heavy issuance, and unfavorable market confirmation.
One of the most important changes for the rest of 2026 will be the amount and type of bond supply. Large technology companies issued approximately $194 billion of debt through early July, 79% more than a year earlier, to help finance AI infrastructure. That spending can support economic growth and corporate profits, but it also creates competition for investor capital. Bondholders must now evaluate not only whether AI investments will earn an adequate return, but also how much additional debt the market will be asked to absorb.
The second-half opportunity is therefore not one sweeping duration call. It is a collection of smaller decisions. Add duration if inflation, oil, and term premiums retreat. Keep short-rate exposure if the Fed remains on hold or hikes. Favor agency MBS if rate volatility settles. Continue harvesting high-yield and EM income while breadth and currencies cooperate. Demand more spread from investment grade when issuance is heavy. The market is offering income again, but the best returns should come from choosing where that income is properly priced.
Holdings
Fixed Income Sector
US 1-3 Month T-bill
US 3-7 Year Treasury
US 10-20 Year Treasury
TIPS (short-term)
US Mortgage-Backed
US Floating Rate
US Corporate
US High Yield
International Corporate Bond
Emerging Market Bond
Outlook (relative to benchmark)
Neutral
Neutral
Neutral
Underweight
Overweight
Neutral
Underweight
Overweight
Underweight
Overweight
Position Details
U.S. TREASURIES — NEUTRAL
The Treasury market is now paying investors for taking duration, but it has not yet removed the reasons for caution. The 3-month bill ended July near 3.78%, the 2-year near 4.30%, the 5-year near 4.45%, the 10-year near 4.74%, the 20-year near 5.29%, and the 30-year near 5.28%. The rise from bills to long bonds is a much different structure from the deeply inverted curves of recent years. It offers better entry yields in intermediate and long maturities, while also revealing how much inflation and fiscal risk investors now assign to time.
The neutral stance across 3–7-Year and 10–20-Year Treasuries reflects that tradeoff. The Long Treasury model remains bearish on the technical cross, price momentum, and credit-default-swap relationship. Equity-market trend and inflation expectations are constructive. In practical terms, long Treasuries can still rally sharply if employment weakens, credit deteriorates, or geopolitical stress reaches risk assets. They are less dependable when the shock begins with oil and inflation.
July’s data improved the inflation story without ending it. CPI slowed to 3.5%, core CPI fell to 2.6%, and producer prices declined. Payroll growth of only 57,000 also suggested that higher rates are affecting hiring. Yet core PCE remained at 3.3%, Brent crude returned to roughly $90, and the Fed’s 9–3 vote exposed a meaningful disagreement over whether rates are high enough. That is not the clean combination that usually starts a lasting duration rally.
The portfolio continues to use T-bills as a place to earn income and preserve flexibility. Intermediate Treasuries offer a better balance of yield and duration than they did in June, while Treasuries provide portfolio insurance at a higher price-volatility cost. A move above 5% in the 10-year could create a more compelling long-term entry point, but only if inflation expectations remain contained. A rally driven by weaker growth would also improve the case. A rally driven only by temporary oil headlines would be less convincing.
For the remainder of 2026, watch Treasury auction demand, foreign buying, the maturity mix of new issuance, the 5-year and 10-year breakeven rates, and the gap between short- and long-term yields. The next signal may come from the curve rather than the Fed. If long yields continue rising while the front end stays anchored, fiscal and inflation risk are dominating. If the
Figure 1: July’s steeper curve improved Treasury income, but long-end inflation and supply risk still limit conviction. CDS rates have moved marginally higher.
U.S. TIPS — UNDERWEIGHT
Short-term TIPS remain underweight because the market is offering inflation protection at a moment when real yields and price trends remain difficult. RSI and the high-yield OAS relationship are bullish. Commodity trends, momentum mean reversion, the moving-average cross, and inflation expectations are bearish. The model is not saying inflation no longer matters. It is saying the protection is not yet being rewarded consistently in market prices.
The inflation picture is unusually split. June CPI declined 0.4% for the month and slowed to 3.5% year over year, while core CPI fell to 2.6%. At the same time, energy prices were still 15.7% above a year earlier, and Brent rose sharply again in July. The 5-year breakeven ended the month at 2.26%, the 10-year breakeven at 2.28%, and the 5-year, 5-year forward measure at 2.30%. The Treasury market expects the energy shock to fade rather than become permanent.
Real yields are the less obvious part of the story. The 5-year TIPS yield reached roughly 2.19% and the 10-year real yield approximately 2.47% at month-end. Those yields provide a much better starting point for long-term inflation protection, but rising real yields also pressure existing TIPS prices. Investors can be right that inflation stays above target and still experience weak total returns if real yields rise faster.
The underweight therefore reflects timing rather than dismissal. Short-term TIPS become more attractive if breakevens fall while oil and wage risk remain elevated, if real yields stabilize, or if the model’s trend indicators improve. A renewed inflation surge that pushes the Fed toward additional hikes could initially hurt both nominal Treasuries and TIPS through higher real yields. The cleaner opportunity would come when inflation compensation is inexpensive, and the rise in real rates has run its course.
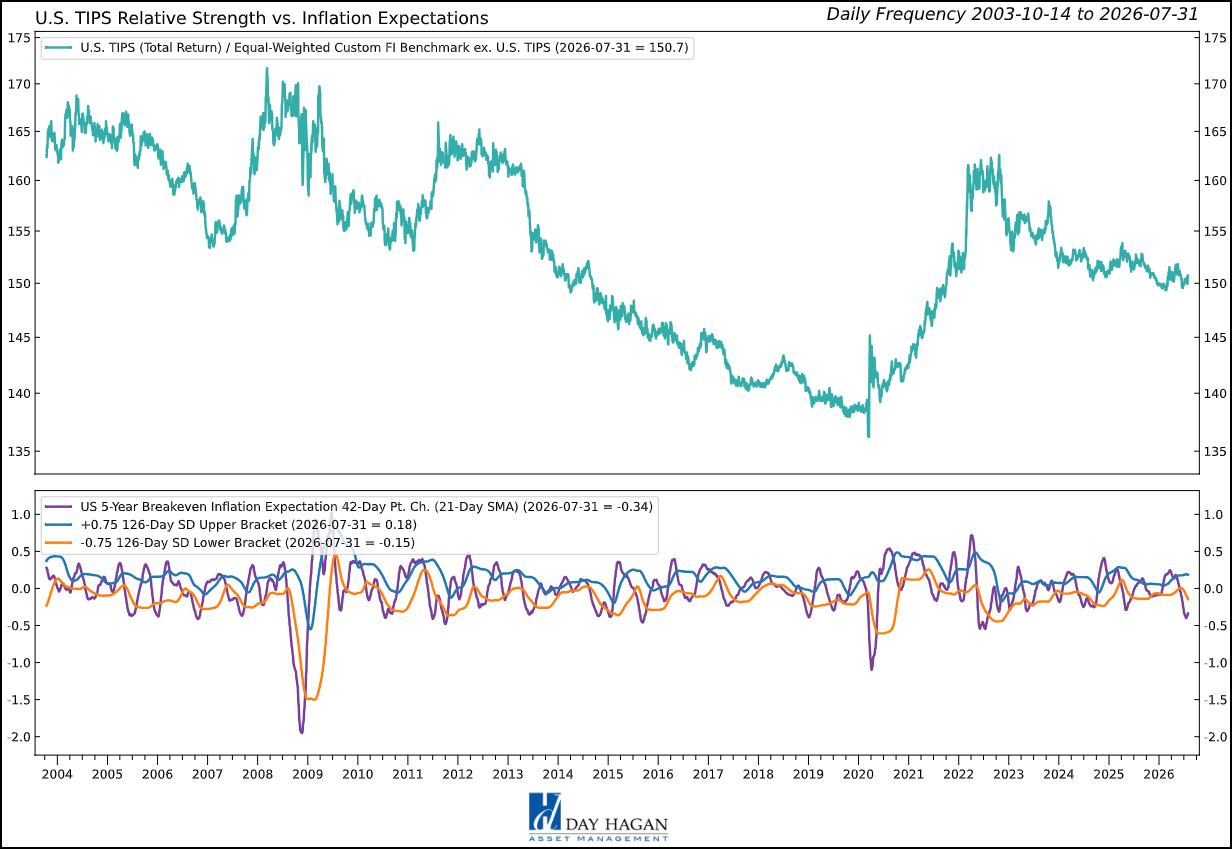
Figure 2: Inflation protection remains useful, but rising real yields and weak trend keep short-term TIPS underweight.
U.S. MORTGAGE-BACKED SECURITIES — OVERWEIGHT
Agency MBS remain overweight because the sector offers a useful combination of government-backed credit quality, income, and improving relative behavior. The moving-average cross, RSI, 10-year-yield relationship, high-yield OAS relationship, and inflation-expectations signal are bullish. Relative-strength slope is the only bearish input. This is the broadest confirmation among the portfolio’s fixed-rate sectors.
The fundamental opportunity comes partly from an uncomfortable housing market. Freddie Mac’s average 30-year mortgage rate rose to 6.66% at the end of July, the highest in roughly a year. High mortgage rates reduce refinancing and keep many homeowners locked into older, lower-rate loans. That slows prepayments and can make agency cash flows more predictable, although it also extends duration when rates rise.
The sector’s advantage over corporate credit is that investors are paid a spread without taking the same default risk. Broad high-grade corporate spreads are near 80 basis points, while companies are issuing record amounts of debt. Agency MBS can provide competitive income with less dependence on corporate earnings, leverage, or refinancing markets. The trade is especially attractive if Treasury volatility falls from elevated levels.
There are still technical headwinds. Federal Reserve MBS holdings declined from approximately $1.95 trillion at the beginning of July to $1.93 trillion late in the month. With the Fed no longer the dominant buyer it once was, banks, money managers, insurers, and overseas investors must absorb more supply. The 10-year yield’s jump to 4.74% also increased extension risk during the month.
For the rest of 2026, the critical variables are the MOVE index, mortgage rates, Fed balance-sheet policy, bank demand, prepayment speeds, and the 10-year Treasury. If rate volatility settles while mortgage rates remain high, agency MBS can collect income with limited refinancing leakage. If the 10-year pushes materially above 5%, prices may face another extension-driven adjustment, but the resulting yield could create an even better long-term entry point.
Figure 3: Strong technical confirmation and high-quality income support the agency MBS overweight.
U.S. FLOATING RATE NOTES — NEUTRAL
Floating-rate notes remain neutral, now with a positive bias. The indicator set is constructive across the technical cross, momentum, relative-strength slope, and OIS swap-rate relationship. VIX extremes are neutral. That improvement deserves recognition, particularly because floating coupons are one of the few areas that can benefit directly if short-term rates stay high.
SOFR was approximately 3.65% at the end of July, while the Fed held its target range at 3.50% to 3.75%. That keeps floating-rate coupons useful and limits price sensitivity to the rise in long Treasury yields. FRNs did not have to absorb the 26-basis-point increase in the 10-year or the 31-basis-point increase in the 30-year in the same way as fixed-rate bonds.
The reason for stopping at neutral is opportunity cost. Three-month T-bills yield roughly 3.78% with simple liquidity and no spread risk. Intermediate Treasuries yield more and can appreciate if growth weakens. Agency MBS and selected credit offer additional spread. Floating-rate notes provide steady income and low duration, but limited upside if the next major move is lower rates.
The rest-of-year decision hinges on the Fed. If oil and tariffs keep inflation elevated and the Fed raises rates, FRNs should remain useful. If payroll growth continues to fade and the market begins pricing cuts, coupons will reset lower, and fixed-rate securities should have greater appreciation potential. Neutral exposure keeps the portfolio paid while preserving room to rotate when that choice becomes clearer.
Figure 4: Improved momentum and high short rates support a neutral floating-rate position with a positive bias
U.S. INVESTMENT-GRADE BONDS — UNDERWEIGHT
Broad U.S. Investment-Grade Bonds, represented by the U.S. Aggregate model, remain underweight. Implied bond volatility, option-adjusted spreads, and price mean reversion are bearish. Credit-default swaps and the technical cross are bullish, while the dollar signal is neutral. The mixed model fits the market. Credit quality is generally sound, but duration, spread valuation, and issuance create an unfavorable margin for error.
All-in yields are more appealing than spreads. Broad investment-grade corporate bonds yielded roughly 5.4% at the end of July, but the spread over Treasuries was only about 80 basis points. Investors are being paid mainly for the underlying Treasury yield, not for taking much corporate risk. That matters when the broad U.S. investment-grade universe contains a large amount of duration and when Treasury yields can move 20 to 30 basis points in a month.
Supply is becoming a central part of the credit story. Amazon, Alphabet, Meta, Microsoft, Oracle, and other hyperscalers issued approximately $194 billion of debt through early July to fund AI infrastructure, up 79% from the prior year. Order-book coverage on new issues fell from nearly five times in February to less than two times by July, and issuers had to offer larger concessions. These companies have strong earnings and access to capital, but even high-quality borrowers can pressure secondary-market prices when supply arrives faster than demand.
July also produced a record $7.1 billion weekly outflow from U.S. investment-grade bond funds during the oil-driven rate scare. That does not imply a credit crisis. It shows how quickly fixed-rate exposure can lose sponsorship when inflation and Treasury yields jump together. Within U.S. IG, the portfolio prefers agency MBS and shorter maturities over long corporates and broad index exposure.
For the remainder of 2026, watch AI-related issuance, new-issue concessions, fund flows, bank and insurer demand, earnings revisions, and downgrade activity. Wider spreads created by supply rather than deteriorating balance sheets could become an attractive opportunity. Wider spreads accompanied by lower earnings and higher leverage would require more patience.
Figure 5: Attractive all-in yields cannot fully offset tight spreads, heavy issuance, and rate sensitivity in U.S. IG.
U.S. HIGH YIELD — OVERWEIGHT
U.S. High Yield remains overweight, though July’s indicator balance argues for discipline. The technical cross, high-yield breadth, and small-cap equity trend are bullish. The absolute total-return moving-average cross, VIX relationship, and OAS-reversal signal are bearish. Participation and equity confirmation remain helpful, but spread behavior warns that the market is not offering a large cushion.
The sector yielded roughly 7.2% at the end of July, with an option-adjusted spread near 284 basis points. That yield can generate meaningful income if defaults remain contained, but the spread is not wide by historical standards. Investors are accepting a relatively modest credit premium because nominal yields are high and the economy is still expanding.
Corporate earnings and equity prices continue to help. The S&P 500’s second-quarter earnings growth estimate increased sharply during July, and small-cap equities held a positive trend. Those conditions usually support refinancing access and reduce near-term default pressure. June payroll growth of only 57,000 deserves attention, however, because weaker employment eventually reaches lower-quality consumer, leisure, retail, and cyclical issuers.
The composition of new supply is also changing. AI-related borrowers accounted for roughly one-quarter of second-quarter high-yield issuance, compared with about 6% a year earlier. Some of those bonds offer double-digit yields, but they introduce project risk, construction risk, power-price exposure, and uncertain terminal value. The AI buildout may create excellent loans and poor loans at the same time.
The overweight favors BB and stronger single-B issuers, positive free cash flow, manageable maturity schedules, secured claims, and businesses that do not need falling rates to refinance. For the rest of 2026, watch breadth, CCC spreads, distressed exchanges, private-credit payment-in-kind income, small-cap equities, and the maturity wall. If OAS widens because Treasury yields rise but defaults remain stable, carry opportunities should improve. If breadth and equity confirmation break together, the overweight should be reconsidered.
Figure 6: High-yield breadth appears oversold.
INTERNATIONAL INVESTMENT-GRADE CORPORATE BONDS — UNDERWEIGHT
International Investment-Grade Bonds, represented by the Global Aggregate model, remain underweight. Relative-strength slope is bullish. Equity risk and VIX, the moving-average cross, option-adjusted spreads, and credit-default swaps are bearish. The single positive trend input is not enough to overcome weak credit and market confirmation.
July’s global bond selloff showed that rate risk is not confined to the United States. Germany’s 10-year Bund yield rose approximately 33 basis points to 3.20%, the U.K. 10-year gilt increased 27 basis points to 5.04%, and Japan’s 10-year yield reached 2.80%. The ECB raised its deposit rate to 2.25% in June, the Bank of England held at 3.75% in July, and the Bank of Japan kept its rate at 1.0% after a June increase. Five major central banks were in hiking mode by month-end as the energy shock complicated inflation policy.
Currency can either improve or overwhelm the local bond return. The euro strengthened during July, the pound firmed modestly, and the yen required official support after approaching 160 per dollar. A U.S. investor holding unhedged international bonds receives the currency return as well as the bond return. Hedging reduces that volatility, but its cost depends on the gap between U.S. and foreign short-term rates.
International IG offers diversification and an average yield near 4% in broad global benchmarks, but the portfolio wants a better combination of policy, spreads, and trend before adding. Europe remains vulnerable to higher natural-gas and oil costs. Japan faces a difficult mix of rising domestic yields and currency management. The U.K. offers high nominal yields, but inflation and fiscal sensitivity remain substantial.
For the remainder of 2026, watch whether the ECB and Bank of England follow the Fed toward further tightening, whether Japan can support the yen without destabilizing JGBs, and whether European energy prices feed into wages. A firmer foreign currency paired with falling local yields would improve dollar-based returns. Rising yields and weakening currencies would be the most difficult combination.
Figure 7: Global yields are higher, but policy divergence, currencies, and weak credit signals keep International IG underweight.
EMERGING MARKET BONDS (USD) — OVERWEIGHT
Emerging-Market USD Bonds remain overweight because the carry, commodity backdrop, currency trend, and relative-strength slope still provide support. The EM currency index versus the dollar, commodity strength, and relative-strength moving-average slope are bullish. Emerging-equity momentum and the absolute moving-average cross are bearish. The position has enough confirmation to remain overweight, but not enough to ignore the rise in U.S. real yields.
USD-denominated EM debt separates sovereign credit risk from direct local-currency exposure. That distinction mattered in July. The Mexican peso and Peruvian sol strengthened, while the Indian rupee and Taiwan dollar weakened. Hard-currency bonds allow investors to earn emerging-market spreads without making every local currency part of the same decision.
Commodity exposure is another differentiator. Oil exporters can benefit from Brent near $90, while oil importers face pressure on inflation and current accounts. Copper and gold support selected Latin American issuers, while China’s uneven demand limits the case for commodity exposure without country-level analysis. The overweight therefore favors diversified exposure rather than a single regional or commodity bet.
Valuation is useful but no longer generous everywhere. Emerging-market corporate OAS was near 150 basis points at the end of July, while sovereign spreads in several stronger countries remained close to multi-year lows. Investors are being paid more than in developed-market IG, but less than they would receive during a broad risk-off event. Country selection, policy credibility, and external financing needs matter more as spreads tighten.
The rest-of-year watchlist includes U.S. real yields, the dollar, China’s growth data, commodity prices, sovereign refinancing calendars, fiscal policy, and elections. A stable or weaker dollar with firm commodities would support the overweight. A renewed dollar surge, weaker EM equities, or a sharp drop in commodity demand would challenge it. We continue to favor liquid sovereign and quasi-sovereign issuers with adequate reserves, improving current accounts, and credible central banks.
Figure 8: Currency and commodity support keep EM bonds overweight despite weaker equity momentum and tight spreads.
Catastrophic Stop Model
The Catastrophic Stop model combines time-tested, objective indicators to identify high-risk periods for equities and fixed-income assets that are highly correlated with the equity market. The model entered August recommending a fully invested allocation relative to the benchmark for credit sectors that are highly correlated with equities.
The weight of the evidence suggests that any weakness in equity is unlikely to extend into a significant downtrend at this time. If our model triggers a sell signal (below 40% for two consecutive days), indicating potentially more substantial problems, we will reduce exposure.
Figure 9: The Catastrophic Stop model recommends a fully invested position (relative to the benchmark). Because the model uses indices to extend its history, it is considered hypothetical.
Hypothetical and historical past performance is not indicative of future results. There can be no assurance that any investment or strategy will achieve its objectives or avoid substantial losses or have comparable results. This information is provided for illustrative purposes only and is not a prediction, projection, or guarantee of future performance. Hypothetical results do not reflect actual trading, were derived using the benefit of hindsight, and may not reflect material economic and market events. Actual results vary and depend on many factors and subject to risk and uncertainties.
Our goal is to stay on the right side of the prevailing trend and introduce risk management when conditions deteriorate. Currently, the uptrend remains intact. The broader-based composite models calling U.S. economic growth, international economic growth, inflation trends, liquidity, and equity demand remain broadly constructive. The Catastrophic Stop model is positive, and we are aligned with the message. If our models shift to bearish levels, we will raise cash and lower exposure to risk-on fixed-income sectors.
This strategy uses measures of price, valuation, economic trends, liquidity, and market sentiment to make objective, rational, and unemotional decisions about how much capital to risk and where to allocate it.
For more information, please contact us at:
Day Hagan Asset Management
1000 S. Tamiami Trl
Sarasota, FL 34236
Toll Free: (800) 594-7930
Office Phone: (941) 330-1702
Website: https://dayhagan.com or https://dhfunds.com
© 2026 Day Hagan Asset Management
This material is for educational purposes only. Further distribution is prohibited without prior permission. Please see the information on Disclosures and Fact Sheets here: https://dhfunds.com/literature. Charts with models and return information use indices for performance testing to extend the model histories, and they should be considered hypothetical. All Rights Reserved.
Day Hagan Smart Sector® Fixed Income ETF
Symbol: SSFI
Disclosures
The data and analysis contained within are provided “as is” and without warranty of any kind, either express or implied. The information is based on data believed to be reliable, but it is not guaranteed. Day Hagan DISCLAIMS ANY AND ALL EXPRESS OR IMPLIED WARRANTIES, INCLUDING, BUT NOT LIMITED TO, ANY WARRANTIES OF MERCHANTABILITY, SUITABILITY, OR FITNESS FOR A PARTICULAR PURPOSE OR USE. All performance measures do not reflect tax consequences, execution, commissions, and other trading costs, and as such, investors should consult their tax advisors before making investment decisions, as well as realize that the past performance and results of the model are not a guarantee of future results. The Smart Sector® Strategy is not intended to be the primary basis for investment decisions, and the usage of the model does not address the suitability of any particular investment for any particular investor.
Using any graph, chart, formula, model, or other device to assist in deciding which securities to trade or when to trade them presents many difficulties, and their effectiveness has significant limitations, including that prior patterns may not repeat themselves continuously or on any particular occasion. In addition, market participants using such devices can impact the market in a way that changes the effectiveness of such devices. Day Hagan believes no individual graph, chart, formula, model, or other device should be used as the sole basis for any investment decision and suggests that all market participants consider differing viewpoints and use a weight-of-the-evidence approach that fits their investment needs.
Past performance does not guarantee future results. No current or prospective client should assume future performance of any specific investment or strategy will be profitable or equal to past performance levels. All investment strategies have the potential for profit or loss. Changes in investment strategies, contributions or withdrawals, and economic conditions may materially alter the performance of your portfolio. Different types of investments involve varying degrees of risk, and there can be no assurance that any specific investment or strategy will be suitable or profitable for a client’s portfolio. Historical performance results for investment indexes and/or categories generally do not reflect the deduction of transaction and/or custodial charges or the deduction of an investment management fee, the incurrence of which would have the effect of decreasing historical performance results. There can be no assurances that a portfolio will match or outperform any particular benchmark. Comparisons to indices are inherently unreliable indicators of future performance. The strategies used to generate the performance vary from those used to generate the returns depicted in the benchmarks. Investors cannot directly invest in an index.
The information contained herein is provided for informational purposes only and should not be construed as investment advice or a recommendation to buy or sell any security. The securities, instruments, or strategies described may not be suitable for all investors, and their value and income may fluctuate. Past performance is not indicative of future results, and there is no guarantee that any investment strategy will achieve its objectives, generate profits, or avoid losses.
This material is intended to provide general market commentary and should not be relied upon as individualized investment advice. Investors should consult with their financial professional before making any investment decisions based on this information.
The material may contain “forward-looking” information that is not purely historical in nature. Such information may include, among other things, projections, forecasts, estimates of market returns, and proposed or expected portfolio composition. Day Hagan Asset Management, its affiliates, employees, or third-party data providers shall not be liable for any loss sustained by any person relying on this information. All opinions and views expressed are subject to change without notice and may differ from those of other investment professionals within Day Hagan Asset Management or Ashton Thomas Private Wealth, LLC.
Accounts managed by Day Hagan Asset Management or its affiliates may hold positions in the securities discussed and may trade such securities without notice.
Day Hagan Asset Management is a division of and doing business as (DBA) Ashton Thomas Private Wealth, LLC, an SEC-registered investment adviser. Registration with the SEC does not imply a certain level of skill or training.
This material is for educational purposes only. Further distribution is prohibited without prior permission. Please see the information on Disclosures and Fact Sheets here: https://dhfunds.com/literature. Charts with models and return information use indices for performance testing to extend the model histories, and they should be considered hypothetical. All Rights Reserved.
All hypothetical results are presented for illustrative purposes only. Back testing and other statistical analysis is provided in use simulated analysis and hypothetical circumstances to estimate how it may have performed prior to its actual existence. The results obtained from "back-testing" information should not be considered indicative of the actual results that might be obtained from an investment or participation in a financial instrument or transaction referencing the Index. The Firm provides no assurance or guarantee that the products/securities linked to the strategy will operate or would have operated in the past in a manner consistent with these materials. The hypothetical historical levels have inherent limitations. Alternative simulations, techniques, modeling or assumptions might produce significantly different results and prove to be more appropriate. Actual results will vary, perhaps materially, from the simulated returns presented.
© 2026 Day Hagan Asset Management
Disclosure
Federal Reserve (Fed) — The central bank of the United States, responsible for setting monetary policy and short-term interest rates.
U.S. Treasuries — Bonds issued by the U.S. government; they are widely used as benchmarks for interest rates and as defensive assets in portfolios.
T-bill (Treasury bill) — A short-term U.S. government security, typically maturing in one year or less.
Duration — A measure of a bond’s sensitivity to changes in interest rates; higher duration usually means greater price movement when yields change.
Yield — The income return on a bond, usually expressed as an annual percentage of its price.
Investment-Grade (IG) Corporate Bonds — Corporate bonds with relatively high credit quality and lower default risk than high-yield bonds.
High-Yield (HY) Bonds — Lower-rated corporate bonds that offer higher yields because they carry higher credit risk.
Private Credit — Non-bank lending, often directly to companies, outside the public bond markets.
TIPS (Treasury Inflation-Protected Securities) — U.S. government bonds designed to protect investors from inflation by adjusting principal based on inflation.
Breakeven Inflation Rate — The market’s implied inflation expectation, calculated as the difference between nominal Treasury yields and TIPS yields.
Real Yield — A bond yield after adjusting for inflation; often referenced in connection with TIPS.
Nominal Yield — A bond yield not adjusted for inflation.
Inflation Expectations — The market’s view of future inflation, which influences both bond yields and asset prices.
Mortgage-Backed Securities (MBS) — Bonds backed by pools of home mortgages; investors receive cash flows from underlying mortgage payments.
Agency MBS — Mortgage-backed securities issued or guaranteed by U.S. government-related agencies, generally viewed as having high credit quality.
Floating Rate Notes (FRNs) — Bonds whose interest payments reset periodically based on a short-term reference rate, reducing interest-rate sensitivity.
SOFR (Secured Overnight Financing Rate) — A key U.S. benchmark short-term interest rate used in loans, derivatives, and floating-rate instruments.
OIS (Overnight Index Swap) Rate — A rate derived from swaps tied to overnight interest rates, often used to gauge policy-rate expectations.
Primary Issuance — The sale of new bonds into the market by governments or companies.
Spread — The yield difference between one bond and a benchmark, often used to measure compensation for credit risk.
Option-Adjusted Spread (OAS) — A spread measure that adjusts for embedded bond options, commonly used in corporate bonds and mortgage-backed securities.
Credit Default Swap (CDS) — A derivative contract used to insure against bond default risk; rising CDS levels often signal greater credit concern.
Carry — The return earned from holding a bond or credit asset, assuming market conditions remain stable.
Refinancing Risk — The risk that a borrower will face higher costs or difficulty when replacing maturing debt with new debt.
Emerging Market (EM) Bonds — Debt issued by governments or companies in developing economies.
Hard-Currency Debt — Emerging-market debt issued in a major foreign currency, usually U.S. dollars or euros.
Local-Currency Debt — Emerging-market debt issued in the borrower’s domestic currency, making returns more sensitive to exchange-rate movements.
Risk-On / Risk-Off — Market environments where investors are either more willing to buy riskier assets (“risk-on”) or prefer safer assets (“risk-off”).
RSI (Relative Strength Index) — A technical indicator used to assess whether an asset may be overbought or oversold.
VIX — A widely followed measure of U.S. equity market volatility, often called the market’s “fear gauge.”