
Day Hagan/Ned Davis Research Smart Sector® Strategy Update April 2023
A downloadable PDF copy of the Article:
Day Hagan/Ned Davis Research Smart Sector® Strategy Update April 2023 (pdf)
Catastrophic Stop Update
The NDR Catastrophic Sell Stop model combines timThe NDR Catastrophic Sell Stop model combines time-tested, objective indicators designed to identify high risk periods for the equity market. The model (chart right) deteriorated in March but remains with a fully invested equity allocation recommendation entering April.

Figure 1: Smart Sector® Catastrophic Stop Sell Model
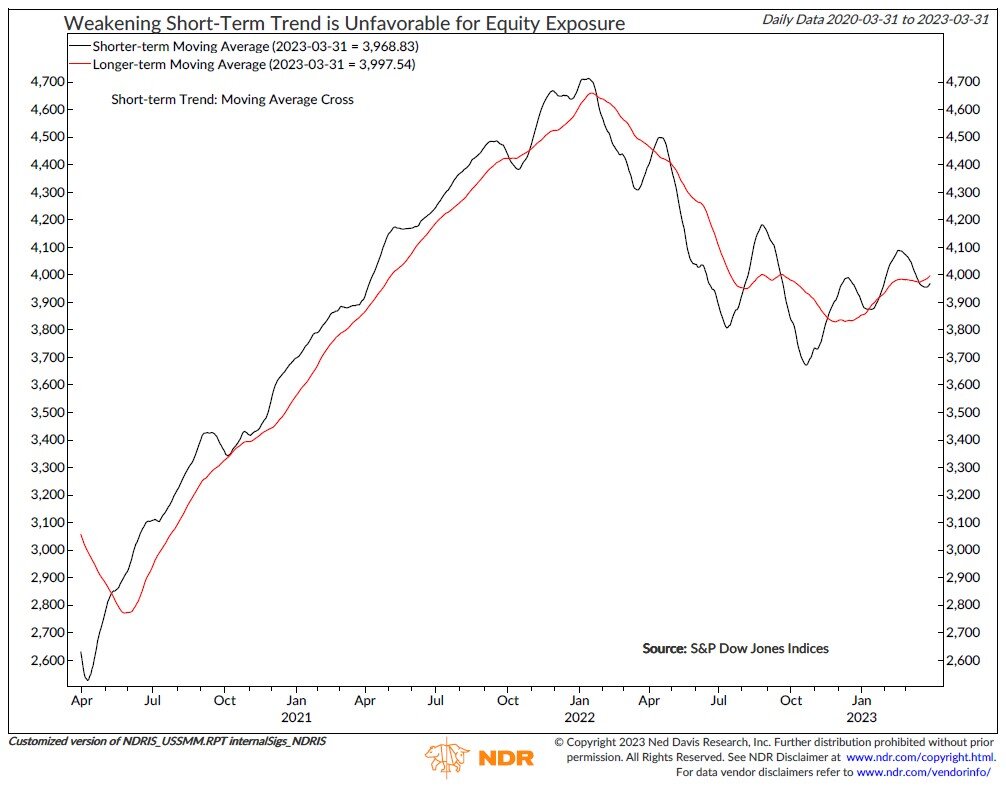
Figure 2: Weakening Short-Term is Unfavorable for Equity Exposure
The model deterioration was mostly driven by weaker technicals—stock/bond relative strength, global stock market breadth, and stock market short-term trend (chart left) all declined to bearish levels during the month. In terms of external influences, improvement in the Baltic Dry Index and breadth for High Yield and Emerging Market bonds was offset by widening high-yield option-adjusted spreads.
If stock volume demand outpaces supply, and trend and relative strength improve, then it could indicate the March rally could be sustained. Conversely, if the stock market weakens in the near term and investors return to fears of a recession, the stock market rally could be short-lived.
U.S. Market Update
After a 2.5% decline in the S&P 500 Total Return Index in February, the market rallied in March and gained over 3.5% for the month. Eight of the 11 S&P 500 sectors registered positive returns in the month of March. The flight-to-safety trade in the days after the Silicon Valley Bank failure was to companies with strong cash flows that are unlikely to have to tap the capital markets in the next few years. The move was most apparent in the mega-cap FANMAG stocks. As a result, the Information Technology and Communication Services sectors posted double-digit gains, while Financials was the weakest sector (chart below).
The rotation into FANMAG stocks has boosted large-cap and cap-weighted benchmarks. While it can be viewed as a positive that investors did not pull their money out of stocks as an asset class, the strongest rallies often start with a high percentage of stocks participating. While 65.6% of Nasdaq stocks are above their 10-day moving averages, only 32.1% are above their 50-day, and 37.8% are above their 200-day. But as we learned from the multiple breath thrust signals in 2022, short-term breadth needs to be verified with intermediate-term and long-term breadth. This cycle, watch for breadth to broaden to include more than a handful of mega-caps. If it does, the market has a good chance of staging a rally deep into the second quarter.
Entering April, the sector model is overweight Value areas such as Energy and Financials, as well as Growth sectors like Information Technology and Communication Services. Interest-rate sensitive sectors such as Consumer Staples, Real Estate, and Utilities improved in allocation and are now slightly above the benchmark weight. Consumer Discretionary dropped in allocation, joining Industrials and Health Care at underweight.
Figure 3: S&P 500 GICS Sector Monthly Performance (02/28/2023 - 03/31/2023)
The Technology sector’s allocation rose significantly in March and is the largest overweight. The sector was up nearly 12% in March, primarily driven by double-digit gains from Microsoft, Apple, and NVIDIA. On a fundamental basis, the improving performance of Emerging Asia stocks and the relative short-interest ratio remain bullish for the sector. Despite a weakening of the change in inflation expectations, several technical measures improved from bearish for the sector, including relative price momentum, an overbought/oversold indicator, and breadth as measured by 50-day net new highs (chart right).

Figure 4: Rising 50-Day Net New Hight is Bullish for the S&P 500 Technology Sector

Figure 5: FANMAG Index Rallying Year-to-Date
Allocation to the Communication Services sector improved in March, moving it from a slightly underweight to an overweight position. The sector was up over 10% in March, primarily driven by about a 21% gain in META, a 15% gain in Alphabet, and a 7% gain in Netflix—all members of our FANMAG Index, which has been rallying this year (chart left). On a fundamental basis, earnings revision breadth and option-adjusted spreads moved bullish for the sector. Four of the six technical measures remain bullish for the sector.
The Financials sector’s allocation declined sharply in April but remains overweight. This past month, while there was an improvement in the 10-2 yield curve, most technical measures deteriorated due to concerns about the banking system. Relative price momentum, relative drawdown, and trend (chart right) all moved bearish. Only one technical measure remains bullish.

Figure 6: S&P 500 Financial Sector Total Return Trend is Bearish

Figure 7: Rising MBA Purchase Index is Bullish for the Real Estate Sector
Interest-rate-sensitive sectors such as Real Estate, Utilities, and Consumer Staples all saw improvements in their allocations in April. All three sectors moved from underweights to slightly above benchmark weights. For Real Estate, the sector saw improvement in industrial production for construction supplies, as well as a rise in mortgage applications (chart left) due to a decline in mortgage rates and home prices. While technicals are mixed, the improvement off the recent lows moved the relative mean reversion indicator to a bullish condition.
Consumer Discretionary’s allocation dropped sharply in April and is now underweight. Technicals caught up with the sector’s already-weak fundamentals (credit conditions, housing starts, discretionary spending, and earnings surprises). The majority of price-based measures are negative. Short-term trend (chart right) and an overbought/oversold indicator both moved bearish during the month.

Figure 8: S&P 500 Consumer Discretionary Sector’s Short-Term Trend is Bearish

Figure 9: Rising Sector Volatility is Bearish for the S&P 500 Industrials Sector
Industrials’ allocation dropped sharply in April and is now a significant underweight. On a fundamental basis, the message remains mixed—valuation, consumer confidence, commodity prices, and industrial production continue to be bearish for the sector. However, price-based measures have caught up—five out of six indicators, including sector volatility (chart left), are bearish.
Summary
The sector allocation strategy’s message is mixed with overweights to Value sectors like Energy and Financials, as well as Growth sectors like Technology and Communications Services. Industrials, Consumer Discretionary, and Health Care are at underweight. The sector model uses sector-specific indicators to determine opportunities and identify risks in an objective, weight-of-the-evidence approach.
NDR Strategists contributing to this publication: Brian Sanborn, CFA, Ed Clissold, CFA, Rob Anderson, CFA, Thanh Nguyen, CFA, Tim Hayes, CMT, Joe Kalish
We welcome the opportunity to provide more color on what we are seeing and answer your questions. Please email or call us anytime to set up a webinar or discuss the strategy and portfolio.
For more information, please contact:
Day Hagan Asset Management
1000 S. Tamiami Trl
Sarasota, FL 34236
Toll Free: (800) 594-7930
Office Phone: (941) 330-1702
Day Hagan/Ned Davis Research
Smart Sector® With Catastrophic Stop ETF
Symbol: SSUS
Strategy Description
The Smart Sector® with Catastrophic Stop strategy combines two Ned Davis Research quantitative investment strategies: The NDR Sector Allocation and the NDR Catastrophic Stop.
The Process Is Based On The Weight Of The Evidence
The fund begins by overweighting and underweighting the S&P 500 sectors based on Ned Davis Research’s proprietary sector models.
Each of the sector models utilize sector-specific, weight-of-the-evidence composites of fundamental, economic, technical, and behavioral indicators to determine each sector’s probability of outperforming the S&P 500.
Sectors are weighted relative to benchmark weightings.
When Market Risks Become Extraordinarily High - Reduce Your Portfolio Risk
The model remains fully invested unless the Ned Davis Research Catastrophic Sell Stop (CSS) model is triggered, whereupon the equity-invested position is trimmed to 50%.
The NDR Catastrophic Sell Stop model combines time-tested, objective indicators designed to identify periods of high risk for the broad U.S. equity market. The model uses price-based, breadth, deviation from trend, fundamental, economic, interest rate, behavioral and volatility-based indicator composites.
When Market Risks Return To Normal — Put Your Money Back To Work
When the NDR CSS model moves back to bullish levels, indicating lower risk, the strategy immediately moves back to fully invested.
Ned Davis Research Disclaimers
The data and analysis contained within are provided "as is" and without warranty of any kind, either express or implied. The information is based on data believed to be reliable, but it is not guaranteed. NDR DISCLAIMS ANY AND ALL EXPRESS OR IMPLIED WARRANTIES, INCLUDING, BUT NOT LIMITED TO, ANY WARRANTIES OF MERCHANTABILITY, SUITABILITY OR FITNESS FOR A PARTICULAR PURPOSE OR USE. All performance measures do not reflect tax consequences, execution, commissions, and other trading costs, and as such investors should consult their tax advisors before making investment decisions, as well as realize that the past performance and results of the model are not a guarantee of future results. The Sector Allocation Strategy is not intended to be the primary basis for investment decisions and the usage of the model does not address the suitability of any particular investment for any particular investor.
Using any graph, chart, formula, model, or other device to assist in deciding which securities to trade or when to trade them presents many difficulties and their effectiveness has significant limitations, including that prior patterns may not repeat themselves continuously or on any particular occasion. In addition, market participants using such devices can impact the market in a way that changes the effectiveness of such devices. NDR believes no individual graph, chart, formula, model, or other device should be used as the sole basis for any investment decision and suggests that all market participants consider differing viewpoints and use a weight of the evidence approach that fits their investment needs.
Disclosures
Past performance does not guarantee future results. No current or prospective client should assume future performance of any specific investment or strategy will be profitable or equal to past performance levels. All investment strategies have the potential for profit or loss. Changes in investment strategies, contributions or withdrawals and economic conditions may materially alter the performance of your portfolio. Different types of investments involve varying degrees of risk, and there can be no assurance that any specific investment or strategy will be suitable or profitable for a client’s portfolio. Historical performance results for investment indexes and/or categories generally do not reflect the deduction of transaction and/or custodial charges or the deduction of an investment management fee, the incurrence of which would have the effect of decreasing historical performance results. There can be no assurances that a portfolio will match or outperform any particular benchmark.
Day Hagan Asset Management is registered as an investment adviser with the United States Securities and Exchange Commission. SEC registration does not constitute an endorsement of the firm by the Commission, nor does it indicate that the adviser has attained a particular level of skill or ability. Day Hagan Asset Management claims compliance with the Global Investment Performance Standards (GIPS®). GIPS is a registered trademark of CFA Institute. CFA Institute does not endorse or promote this organization, nor does it warrant the accuracy or quality of the content contained herein. Day Hagan Asset Management has been independently verified for the periods June 30, 2008, through December 31, 2020. To receive a GIPS composite report, contact Linda Brown at (941) 330-1702 or email at linda.brown@dayhagan.com.
References to “NDR” throughout refer to Ned Davis Research, Inc. Clients engaging in this strategy will be advised by Day Hagan and will not have a contractual relationship with NDR. Day Hagan purchases signals from NDR, and Day Hagan is responsible for executing transactions on behalf of its clients and has discretion in how to implement the strategy.
NDR is registered as an investment adviser with the Securities and Exchange Commission (SEC). NDR serves as the Signal Provider in connection with this strategy. The information provided here has not been approved or verified by the SEC or by any state or other authority. Additional information about NDR also is available on the SEC's website at https://www.adviserinfo.sec.gov/. This material is provided for informational purposes only and is not intended as an offer or solicitation with respect to the purchase or sale of any security or other financial instrument or to participate in any trading strategy. NDR’s strategies, including the model discussed in this publication, are intended to be used only by sophisticated investment professionals.
There may be a potential tax implication with a rebalancing strategy. Rebalancing involves selling some positions and buying others, and this activity results in realized gains and losses for the positions that are sold. The performance calculations do not reflect the impact that paying taxes would have, and for taxable accounts, any taxable gains would reduce the performance on an after-tax basis. This reduction could be material to the overall performance of an actual trading account. NDR does not provide legal, tax or accounting advice. Please consult your tax advisor in connection with this material, before implementing such a strategy, and prior to any withdrawals that you make from your portfolio.
There is no guarantee that any investment strategy will achieve its objectives, generate dividends, or avoid losses.
© 2023 Ned Davis Research, Inc. | © 2023 Day Hagan Asset Management, LLC
© Copyright Ned Davis Research, Inc. All Rights Reserved | These materials are historical and intended to be used only as examples, and do not necessarily reflect current views or advice of NDR or its representatives.
