
Day Hagan/Ned Davis Research Smart Sector® International Strategy Update September 2023
A downloadable PDF copy of the Article:
Day Hagan/Ned Davis Research Smart Sector® International Strategy Update September 2023 (pdf)
Catastrophic Stop Update
The NDR Catastrophic Stop Sell model combines time-tested, objective indicators designed to identify high-risk periods for the equity market. The model (chart right) deteriorated slightly from last month but entered September with a fully invested equity allocation recommendation.

Figure 1: Smart Sector Catastrophic Stop Sell Model image.
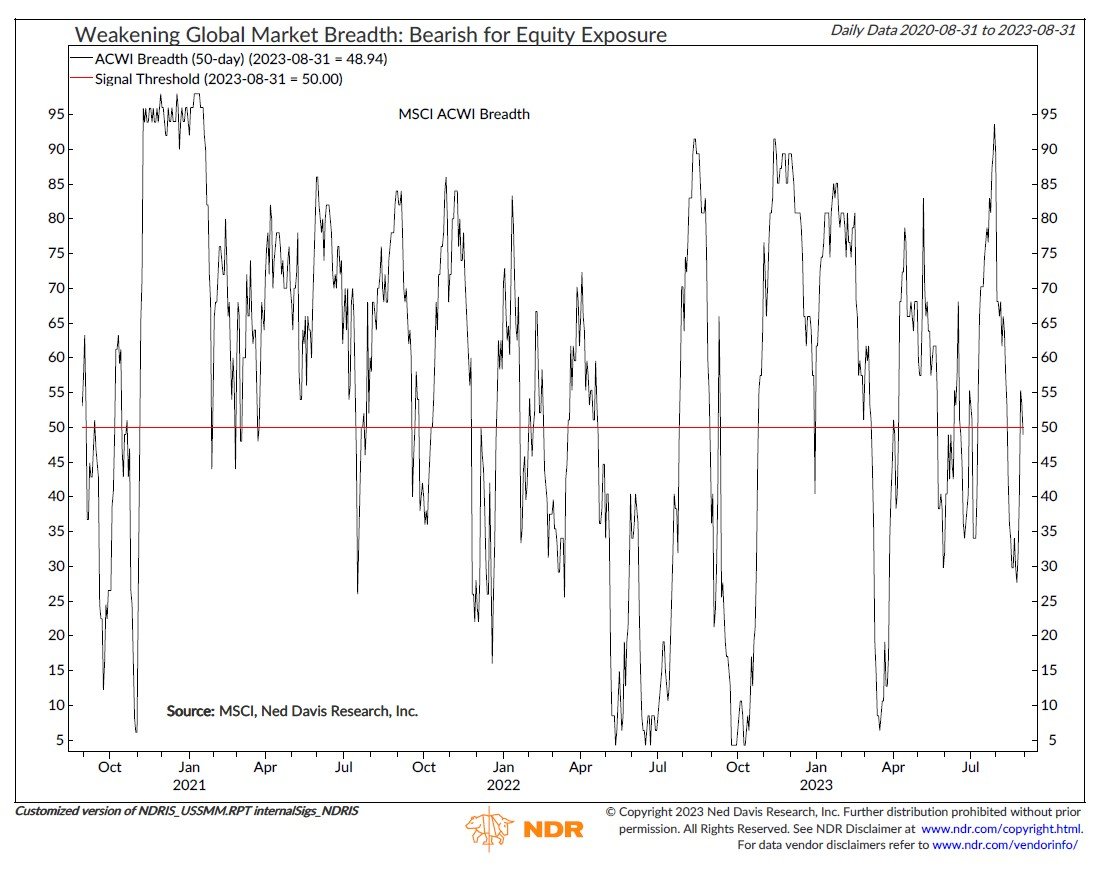
Figure 2: Weakening Global Market Breadth: Bearish for Equity Exposure
The model’s overall bullish position is driven by four of the seven (price-based) measures that remain positive for stocks. However, global market breadth weakened during the month and flashed a sell signal (chart left). While external influences such as trade and market sentiment remained bearish and neutral, respectively, they’re offset by bullish readings from high-yield and emerging market bond breadth, as well as high-yield option-adjusted spreads. For now, the weight of the evidence recommends a fully invested allocation to equity sectors according to the model.
Global Market Update
The ACWI ex. U.S. Total Return Index declined by almost 450 basis points (bps) in August. After gaining more than 400 bps for two consecutive months, the index suffered its largest monthly decline since last September. Among the strongest-performing markets were Egypt, Turkey, Hungary, and Denmark, while the largest underperformers included the Philippines, Singapore, Poland, South Africa, and Colombia.
S&P Global Purchasing Managers’ Index (PMI) data continues to signal a softening global economy. The global composite (services and manufacturing) PMI fell for a second straight month in July to its weakest reading since January. The continuous upside momentum from the first half of the year appears to be fading. Leading indicators within the PMI reports, such as new orders, backlogs, and future output, all point to weakening momentum in the coming months.
Continued adjustments to the pandemic-related imbalances have caused price pressures to ease considerably. The global composite input price index sank to a 33-month low in July (chart bottom). Although most of the price weakness has been in the manufacturing sector, services costs still grew at the slowest pace since December 2020.
However, the risk of global recession, which is historically associated with large equity bear markets, doesn’t appear to be a near-term risk. The latest PMI reading marked the sixth straight month of global expansion after declining throughout most of the second half of last year. The composite is also well above the threshold that has historically been associated with global recession. Furthermore, many emerging markets outside of China have maintained resiliency and are contributing to some stabilization in the manufacturing PMI. Among developed economies, growth remains positive in Japan.
Entering September, the non-U.S. equity Core model overweighted Australia, Germany, Japan, and China while underweighting the U.K., Canada, France, and Switzerland. The Explore model favored Poland, Mexico, Peru, Spain, and India.
Figure 3: Global Services PMI: Input Prices
Core Allocations
Australia moved further overweight as its allocation increased for September. Australia was one of the top-performing markets in the ACWI toward the end of August. On a local currency basis, the MSCI Australia Index (local currency) is less than 5% from its all-time high. The trend is supported by improving upside participation. More than half of Australian companies are trading above their 200-day moving averages (chart right). The Reserve Bank of Australia kept its core interest rate steady, as unemployment rose to 3.7% last month.

Figure 4: Australia Percentage Stocks Trading Above 200-Day Moving Averages

Figure 5: MSCI Japan Relative Strength Rising; Reflects Favorable External Indicators
Japan increased to overweight allocation for September. Most aggregate measures of economic activity point to continued but slower growth in the second half of the year. The flash composite PMI was at 52.6 in August, led by ongoing strength in the services sector. While the PMI is down from its peak earlier this year, it’s higher than any other economy in the G7. Similarly, the Now-Casting Index of Economic Activity, while down from its peak in Q2, is still comfortably above its long-term average. A weaker yen has also helped boost demand for Japanese goods. Japan’s relative strength to other markets continues to improve (chart left).
The U.K. remained below benchmark allocation. Only two of its indicators are bullish. The market is now oversold, which may drive a near-term bounce. Price-based indicators have deteriorated, which coincides with weaker economic data. Most aggregate measures of the economy point to stagnation, or even modest contraction, in the near term. The composite PMI for August slipped into negative territory for the first time in seven months, as both services and manufacturing activity contracted. Similarly, the Now-Casting index of Economic Activity fell for a second straight month (chart right).

Figure 6: United Kingdom: Now-Casting Index of Economic Activity

Figure 7: MSCI Europe ex UK (Local Currency)
Both Switzerland and France maintained underweight positions. The continuation of high inflation and tighter monetary policy has taken its toll on the European economy. With potential growth in the eurozone quite low, it won’t take much to put the economy into recession. The flash composite PMI for August fell to 47.0, its third straight month in contraction territory (i.e., below 50) and a 33-month low. The Ifo business climate index, an excellent leading indicator for the economy, fell to 85.7 in August, the lowest level since December. The Citigroup Economic Surprise Index has been trending around its lowest level since the beginning of the pandemic (chart left). The latest ECB Bank Lending Survey indicated further weakening conditions for bank lending.
Explore Opportunities
Among the top-ranked Explore markets are Poland, Mexico, Peru, Spain, and India:
Poland, Mexico, Peru, Spain, and India have favorable price trends as their 50-day moving averages trade above their 200-day counterparts.
Within the last 21 days, Poland, Mexico, and Spain are more than one standard deviation oversold, which historically has provided a near-term bounce opportunity.
Peru, Poland, and Mexico have low market capitalization-to-GDP ratios, which typically indicate a favorable valuation.
Spain’s composite PMI resides in the expansionary zone.
Mexico is one of the few economies with a Composite Leading Indicator in expansionary territory (chart bottom).

Figure 8: OECD Mexico Composite Leading Index
Summary
The Catastrophic Stop model declined from last month, but it continues to recommend a fully invested allocation.
Entering September, the non-U.S. equity Core model overweighted Australia, Germany, Japan, and China while underweighting the U.K., Canada, France, and Switzerland. The Explore model favored Poland, Mexico, Peru, Spain, and India.
The models combine macro, fundamental, technical, and sentiment indicators to determine opportunities and identify risks in an objective, weight-of-the-evidence approach.
NDR Strategists contributing to this publication: Brian Sanborn, CFA, Ed Clissold, CFA, Rob Anderson, CFA, Thanh Nguyen, CFA, Tim Hayes, CMT, Joe Kalish
For more information, please contact:
Day Hagan Asset Management
1000 S. Tamiami Trl
Sarasota, FL 34236
Toll-Free: (800) 594-7930
Office Phone: (941) 330-1702
Day Hagan/Ned Davis Research
Smart Sector® International ETF
Symbol: SSXU
Strategy Description
The Smart Sector® International strategy combines three Ned Davis Research quantitative investment strategies: The Core International, Explore International, and the NDR Catastrophic Stop
The Process Is Based On The Weight Of The Evidence
Core Allocation
The fund begins by overweighting and underweighting the largest non-U.S. equity markets based on Ned Davis Research’s proprietary models.
Each of the models utilizes market-specific, weight-of-the-evidence composites of fundamental, economic, technical, and behavioral indicators to determine each area’s probability of outperforming the ACWI ex. U.S. Markets are weighted accordingly relative to benchmark weightings.
Explore Allocation
To select smaller markets, the fund uses a multi-factor technical ranking system to choose the top markets. The markets with the highest rankings split the non-Core model allocation equally.
When Market Risks Become Extraordinarily High — Reduce Your Portfolio Risk
The model remains fully invested unless the Ned Davis Research Catastrophic Sell Stop (CSS) model is triggered, whereupon the equity-invested position is trimmed to 50%.
The NDR Catastrophic Sell Stop model combines time-tested, objective indicators designed to identify periods of high risk for the global equity market. The model uses price-based, breadth, deviation from trend, fundamental, economic, interest rate, behavioral, and volatility-based indicator composites.
When Market Risks Return To Normal — Put Your Money Back To Work
When the NDR CSS model moves back to bullish levels, indicating lower risk, the strategy immediately moves back to fully invested.
Ned Davis Research Disclaimers
The data and analysis contained within are provided "as is" and without warranty of any kind, either express or implied. The information is based on data believed to be reliable, but it is not guaranteed. NDR DISCLAIMS ANY AND ALL EXPRESS OR IMPLIED WARRANTIES, INCLUDING, BUT NOT LIMITED TO, ANY WARRANTIES OF MERCHANTABILITY, SUITABILITY OR FITNESS FOR A PARTICULAR PURPOSE OR USE. All performance measures do not reflect tax consequences, execution, commissions, and other trading costs, and as such investors should consult their tax advisors before making investment decisions, as well as realize that the past performance and results of the model are not a guarantee of future results. The Smart Sector® Strategy is not intended to be the primary basis for investment decisions and the usage of the model does not address the suitability of any particular in investment for any particular investor.
Using any graph, chart, formula, model, or other device to assist in deciding which securities to trade or when to trade them presents many difficulties and their effectiveness has significant limitations, including that prior patterns may not repeat themselves continuously or on any particular occasion. In addition, market participants using such devices can impact the market in a way that changes the effectiveness of such devices. NDR believes no individual graph, chart, formula, model, or other device should be used as the sole basis for any investment decision and suggests that all market participants consider differing viewpoints and use a weight of the evidence approach that fits their investment needs.
Disclosures
Past performance does not guarantee future results. No current or prospective client should assume future performance of any specific investment or strategy will be profitable or equal to past performance levels. All investment strategies have the potential for profit or loss. Changes in investment strategies, contributions or withdrawals and economic conditions may materially alter the performance of your portfolio. Different types of investments involve varying degrees of risk, and there can be no assurance that any specific investment or strategy will be suitable or profitable for a client’s portfolio. Historical performance results for investment indexes and/or categories generally do not reflect the deduction of transaction and/or custodial charges or the deduction of an investment management fee, the incurrence of which would have the effect of decreasing historical performance results. There can be no assurances that a portfolio will match or outperform any particular benchmark.
Day Hagan Asset Management is registered as an investment adviser with the United States Securities and Exchange Commission. SEC registration does not constitute an endorsement of the firm by the Commission nor does it indicate that the adviser has attained a particular level of skill or ability.
References to “NDR” throughout refer to Ned Davis Research, Inc. Clients engaging in this strategy will be advised by Day Hagan and will not have a contractual relationship with NDR. Day Hagan purchases signals from NDR, and Day Hagan is responsible for executing transactions on behalf of its clients and has discretion in how to implement the strategy.
NDR is a registered as an investment adviser with the Securities and Exchange Commission (SEC). NDR serves as the Signal Provider in connection with this strategy. The information provided here has not been approved or verified by the SEC or by any state or other authority. Additional information about NDR also is available on the SEC's website at https://www.adviserinfo.sec.gov/. This material is provided for informational purposes only and is not intended as an offer or solicitation with respect to the purchase or sale of any security or other financial instrument or to participate in any trading strategy. NDR’s strategies, including the model discussed in this publication, are intended to be used only by sophisticated investment professionals.
There may be a potential tax implication with a rebalancing strategy. Re-balancing involves selling some positions and buying others, and this activity results in realized gains and losses for the positions that are sold. The performance calculations do not reflect the impact that paying taxes would have, and for taxable accounts, any taxable gains would reduce the performance on an after-tax basis. This reduction could be material to the overall performance of an actual trading account. NDR does not provide legal, tax or accounting advice. Please consult your tax advisor in connection with this material, before implementing such a strategy, and prior to any withdrawals that you make from your portfolio.
There is no guarantee that any investment strategy will achieve its objectives, generate dividends or avoid losses.
© 2023 Ned Davis Research, Inc. | © 2023 Day Hagan Asset Management, LLC
© Copyright Ned Davis Research, Inc. All Rights Reserved | These materials are historical and intended to be used only as examples, and do not necessarily reflect current views or advice of NDR or its representatives.
