
Day Hagan/Ned Davis Research Smart Sector® International Strategy Update March 2023
A downloadable PDF copy of the Article:
Day Hagan/Ned Davis Research Smart Sector® International Strategy Update March 2023 (pdf)
Catastrophic Stop Update
The NDR Catastrophic Sell Stop model combines time-tested, objective indicators designed to identify high risk periods for the equity market. The model (chart right) improved in March and remained with a fully invested equity allocation recommendation.

Figure 1: Smart Sector Catastrophic Stop Sell Model image.
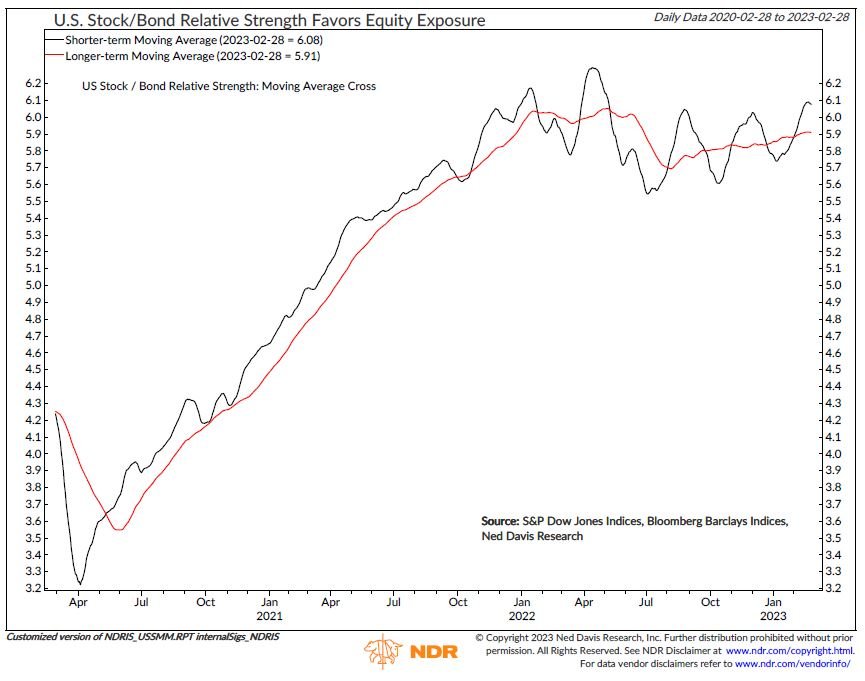
Figure 2: U.S. Stock/Bond Relative Strength Favors Equity Exposure.
Stronger breadth and relative strength drove the model improvement. On February 2, a breadth thrust signal (10-day advances vs. 10-day declines) flashed bullish and the stock/bond relative strength’s short-term moving average rose above its long-term moving average (chart left). In terms of external influences, improvement in short-term stock market sentiment was offset by deterioration in high yield and Emerging Market bond breadth.
If stock volume demand outpaces supply and global shipping rates improve, then it could indicate the rally could be sustained. Conversely, if the stock market weakens in the near-term and investors return to fears of a recession, the stock market rally could be short-lived.
Global Market Update
The ACWI ex. U.S. Total Return Index declined by almost 350 basis points in February. It was the index’s worst month since September. Among the strongest performing markets were Czech Republic, Greece, Turkey, Egypt, and Austria, while the largest underperformers included Colombia, China, Thailand, Brazil, and South
The global economy showed signs of stabilization at the start of the year, according to the latest S&P Global Purchasing Managers’ Index (PMI) readings. The global composite PMI increased 1.6 points in January, its largest gain in seven months, to a six-month high.
Contrary to the prior month’s global PMI, which increased slightly on a month-to-month basis but showed other areas of weakness, the latest global data were broadly positive, as both the manufacturing (chart at bottom) and services indexes rose. Moreover, the composite indexes for new orders (including export orders), employment, and backlogs all increased, indicating improving global demand.
Conditions are likely to pick up, as the future output index jumped at one of its fastest paces on record and to its highest level since April. China’s reopening, due to the end of the zero-COVID policy, explained much of the rebound. But the improving trend occurred elsewhere, albeit to a lesser degree, as the global composite PMI ex-China also increased.
But the global economic outlook is not without risk. The latest composite reading is historically consistent with just 0.5% real Gross Domestic Product (GDP) growth. Moreover, history suggests that the past year’s tight monetary policy will continue to negatively impact the global economy for at least the next six months, while a pick-up in input cost pressures may keep central banks tighter for longer, prolonging the headwinds from central banks.
Entering March, the non-U.S. equity Core model overweighted France, Australia, and Switzerland, while underweighting Japan, the U.K., Canada, China, and Germany. The Explore model favored Chile, Mexico, Netherlands, New Zealand, and Thailand.
Figure 3: Breadth of Manufacturing Purchasing Managers’ Indexes (PMI) Improving.
Core Allocations
France’s allocation continues to be above benchmark weighting. The market has rallied to near its all-time high. The trend is positive as the market trades above its 50- and 200-day moving averages. The strengthening technicals reflect macroeconomic and fundamental improvement. France’s services PMI crossed into expansionary territory this month (chart at right). Earnings growth remains positive on a year-over-year basis.
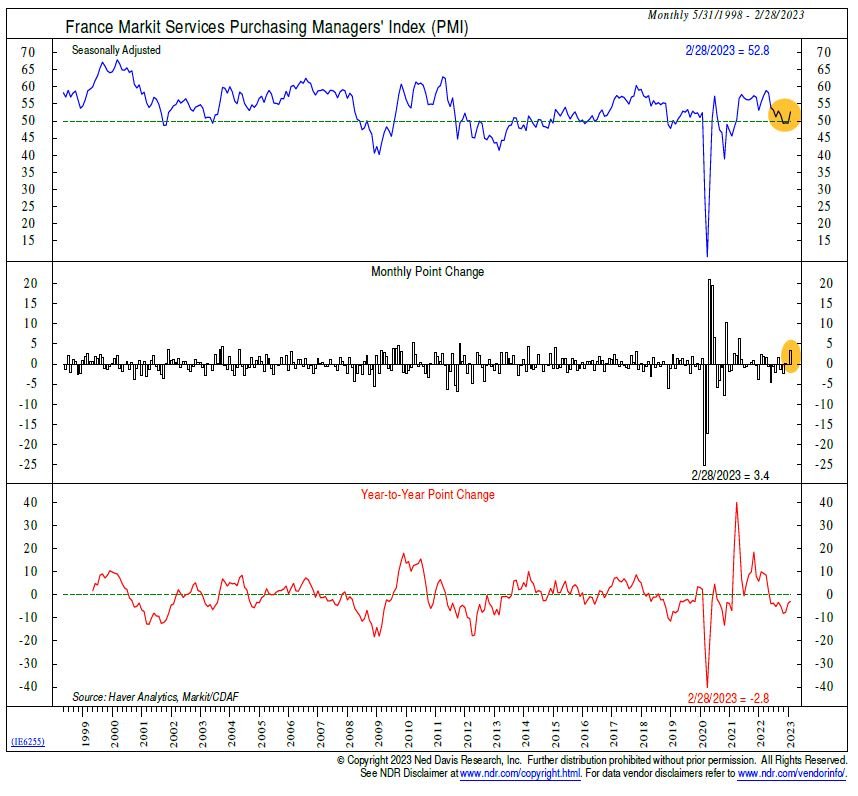
Figure 4: France Markit Services Purchasing Manger's’ Index (PMI)
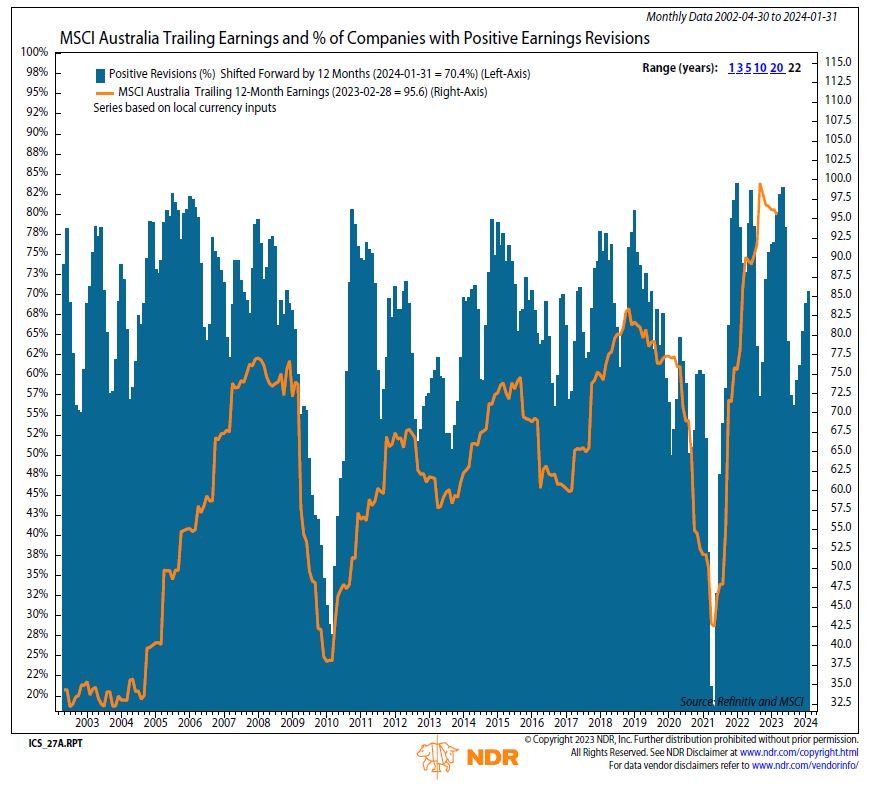
Figure 5: MSCI Australia Trailing Earnings and Percentage of Companies with Positive Earnings Revisions.
Australia is overweight for March as its earnings revisions are among the strongest in the world (chart at left). More than 70% of companies have positive revisions. Australia is likely to get an economic boost from China’s reopening. Prior to the COVID pandemic, China was Australia’s leading visitor market with Australia receiving 1.4 million visitors from China, which contributed $12.4 billion in visitor spend1. The market’s cyclically adjusted price-to-earnings ratio is in the second cheapest quintile, which has historically provided a favorable reward-to-risk ratio. Australia’s intermediate-term trend resides above its long-term trend and the market has risen near its all-time high.
1 https://www.travelweekly.com.au/article/tourism-australia-to-entice-chinese-travellers-through-new-campaign/
Germany declined to underweight status. The eurozone composite PMI was in negative territory throughout the second half of last year, a condition consistent with recession. Manufacturing has been hit harder than the services sector due to higher energy prices and COVID-related disruptions in China. The biggest threat continues to be energy, as Russia will no longer be the primary supplier of energy for the region anytime in the foreseeable future.
Headline CPI peaked in October at 10.6%, and as of January, has fallen to 8.5%. If the warmer weather continues, along with more favorable base effects, the impact of energy on CPI will continue to wane. However, core inflation held at 5.2% in January, the highest for the region since data began in 1990, indicating second-round effects from the higher energy and food costs (chart at right). Although the easing in the headline CPI is encouraging, it’s still over four times greater than the ECB’s target of 2%. Higher inflation coupled with the resiliency of the economy, may push the ECB to be more aggressive, creating risks to the growth outlook.
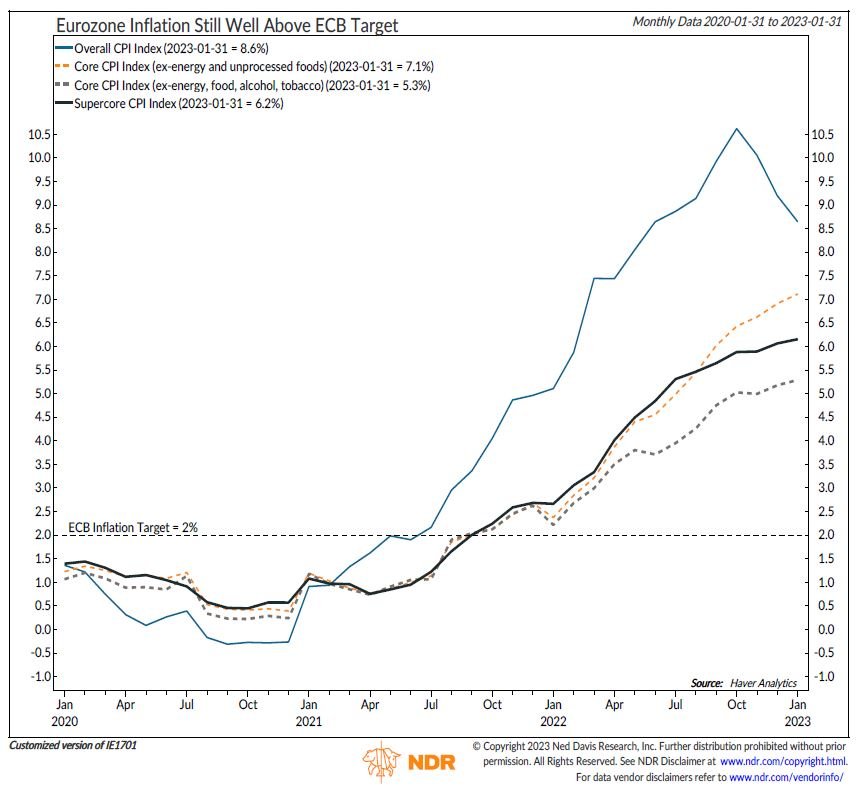
Figure 6: Eurozone Inflation Still Well Above ECB Target
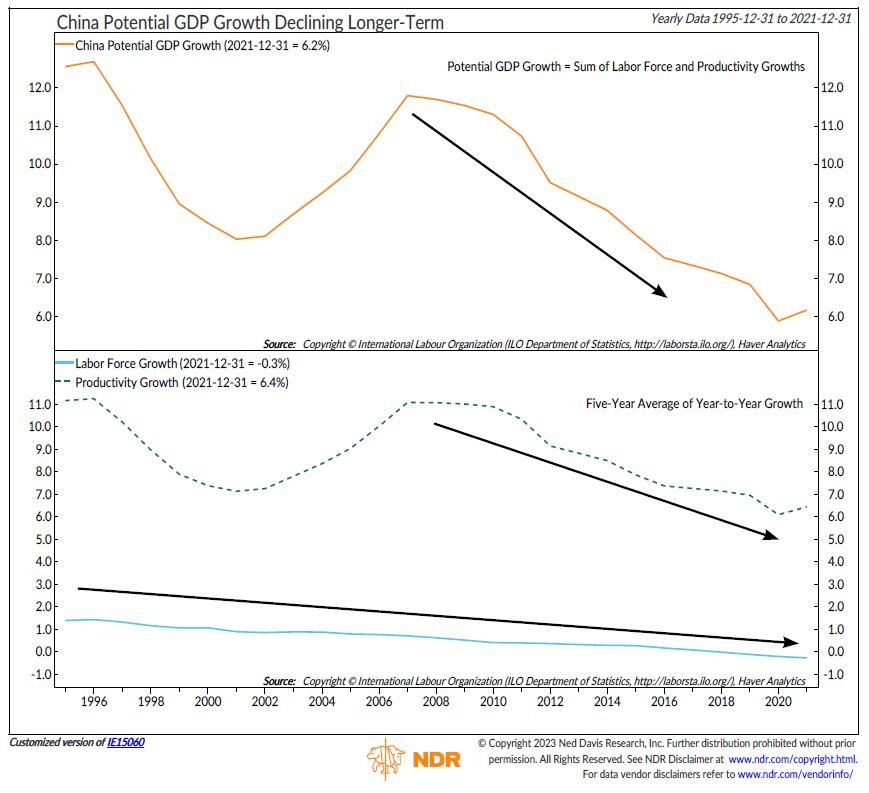
Figure 7: China Potential GDP Growth Declining Longer-Term
China fell to the most underweight market. The recent removal of the zero-COVID policy is bound to unleash some economic might. But the reopening will be bumpy, as it was forced and premature due to a lack of preparedness on the vaccine and healthcare front. Consumer-related data for December showed that households voluntarily disengaged from the economy amid fears of illness.
Explore Opportunities
Among the top ranked Explore markets are Chile, Mexico, Netherlands, New Zealand, and Thailand:
Mexico, Netherlands, New Zealand, and Thailand have favorable price trends as their 50-day moving averages trade above their 200-day moving averages.
Over the last 5 days, Thailand is more than one standard deviation oversold, which historically has provided a near-term bounce opportunity.
Chile, Mexico, and New Zealand have low market capitalization-to-GDP ratios, which typically indicates a favorable valuation.
Chile, Mexico, and Thailand possess cyclically adjusted price-to-earnings ratios (long-term valuation metrics) trading below their historical medians.
Mexico is one of the few economies with a Composite Leading Indicator reading in expansionary territory.
New Zealand and Thailand have elevated manufacturing PMIs, which are in the expansionary zone.
Netherland’s forecasted earnings growth is near the highest levels over the last decade (chart at bottom).

Figure 8: Netherlands’ Forecast EPS Growth Near Highest Levels In Last Decade.
Summary
The Catastrophic Stop model recommended a fully invested position according to the Core and Explore allocation models. The Core model overweighted France, Australia, and Switzerland, while underweighting Japan, the U.K., Canada, China, and Germany. The Explore model favored Chile, Mexico, Netherlands, New Zealand, and Thailand. The models combine macro, fundamental, technical, and sentiment indicators to determine opportunities and identify risks in an objective, weight-of-the-evidence approach.
NDR Strategists contributing to this publication: Brian Sanborn, CFA, Ed Clissold, CFA, Rob Anderson, CFA, Thanh Nguyen, CFA, Tim Hayes, CMT, Joe Kalish
For more information, please contact:
Day Hagan Asset Management
1000 S. Tamiami Trl
Sarasota, FL 34236
Toll-Free: (800) 594-7930
Office Phone: (941) 330-1702
Day Hagan/Ned Davis Research
Smart Sector® International ETF
Symbol: SSXU
Strategy Description
The Smart Sector® International strategy combines three Ned Davis Research quantitative investment strategies: The Core International, Explore International, and the NDR Catastrophic Stop
The Process Is Based On The Weight Of The Evidence
Core Allocation
The fund begins by overweighting and underweighting the largest non-U.S. equity markets based on Ned Davis Research’s proprietary models.
Each of the models utilizes market-specific, weight-of-the-evidence composites of fundamental, economic, technical, and behavioral indicators to determine each area’s probability of outperforming the ACWI ex. U.S. Markets are weighted accordingly relative to benchmark weightings.
Explore Allocation
To select smaller markets, the fund uses a multi-factor technical ranking system to choose the top markets. The markets with the highest rankings split the non-Core model allocation equally.
When Market Risks Become Extraordinarily High — Reduce Your Portfolio Risk
The model remains fully invested unless the Ned Davis Research Catastrophic Sell Stop (CSS) model is triggered, whereupon the equity-invested position is trimmed to 50%.
The NDR Catastrophic Sell Stop model combines time-tested, objective indicators designed to identify periods of high risk for the global equity market. The model uses price-based, breadth, deviation from trend, fundamental, economic, interest rate, behavioral, and volatility-based indicator composites.
When Market Risks Return To Normal — Put Your Money Back To Work
When the NDR CSS model moves back to bullish levels, indicating lower risk, the strategy immediately moves back to fully invested.
Ned Davis Research Disclaimers
The data and analysis contained within are provided "as is" and without warranty of any kind, either express or implied. The information is based on data believed to be reliable, but it is not guaranteed. NDR DISCLAIMS ANY AND ALL EXPRESS OR IMPLIED WARRANTIES, INCLUDING, BUT NOT LIMITED TO, ANY WARRANTIES OF MERCHANTABILITY, SUITABILITY OR FITNESS FOR A PARTICULAR PURPOSE OR USE. All performance measures do not reflect tax consequences, execution, commissions, and other trading costs, and as such investors should consult their tax advisors before making investment decisions, as well as realize that the past performance and results of the model are not a guarantee of future results. The Smart Sector® Strategy is not intended to be the primary basis for investment decisions and the usage of the model does not address the suitability of any particular in investment for any particular investor.
Using any graph, chart, formula, model, or other device to assist in deciding which securities to trade or when to trade them presents many difficulties and their effectiveness has significant limitations, including that prior patterns may not repeat themselves continuously or on any particular occasion. In addition, market participants using such devices can impact the market in a way that changes the effectiveness of such devices. NDR believes no individual graph, chart, formula, model, or other device should be used as the sole basis for any investment decision and suggests that all market participants consider differing viewpoints and use a weight of the evidence approach that fits their investment needs.
Disclosures
Past performance does not guarantee future results. No current or prospective client should assume future performance of any specific investment or strategy will be profitable or equal to past performance levels. All investment strategies have the potential for profit or loss. Changes in investment strategies, contributions or withdrawals and economic conditions may materially alter the performance of your portfolio. Different types of investments involve varying degrees of risk, and there can be no assurance that any specific investment or strategy will be suitable or profitable for a client’s portfolio. Historical performance results for investment indexes and/or categories generally do not reflect the deduction of transaction and/or custodial charges or the deduction of an investment management fee, the incurrence of which would have the effect of decreasing historical performance results. There can be no assurances that a portfolio will match or outperform any particular benchmark.
Day Hagan Asset Management is registered as an investment adviser with the United States Securities and Exchange Commission. SEC registration does not constitute an endorsement of the firm by the Commission nor does it indicate that the adviser has attained a particular level of skill or ability.
References to “NDR” throughout refer to Ned Davis Research, Inc. Clients engaging in this strategy will be advised by Day Hagan and will not have a contractual relationship with NDR. Day Hagan purchases signals from NDR, and Day Hagan is responsible for executing transactions on behalf of its clients and has discretion in how to implement the strategy.
NDR is a registered as an investment adviser with the Securities and Exchange Commission (SEC). NDR serves as the Signal Provider in connection with this strategy. The information provided here has not been approved or verified by the SEC or by any state or other authority. Additional information about NDR also is available on the SEC's website at https://www.adviserinfo.sec.gov/. This material is provided for informational purposes only and is not intended as an offer or solicitation with respect to the purchase or sale of any security or other financial instrument or to participate in any trading strategy. NDR’s strategies, including the model discussed in this publication, are intended to be used only by sophisticated investment professionals.
There may be a potential tax implication with a rebalancing strategy. Re-balancing involves selling some positions and buying others, and this activity results in realized gains and losses for the positions that are sold. The performance calculations do not reflect the impact that paying taxes would have, and for taxable accounts, any taxable gains would reduce the performance on an after-tax basis. This reduction could be material to the overall performance of an actual trading account. NDR does not provide legal, tax or accounting advice. Please consult your tax advisor in connection with this material, before implementing such a strategy, and prior to any withdrawals that you make from your portfolio.
There is no guarantee that any investment strategy will achieve its objectives, generate dividends or avoid losses.
© 2023 Ned Davis Research, Inc. | © 2023 Day Hagan Asset Management, LLC
© Copyright Ned Davis Research, Inc. All Rights Reserved | These materials are historical and intended to be used only as examples, and do not necessarily reflect current views or advice of NDR or its representatives.
