
Day Hagan/Ned Davis Research Smart Sector® International Strategy Update June 2023
A downloadable PDF copy of the Article:
Day Hagan/Ned Davis Research Smart Sector® International Strategy Update June 2023 (pdf)
Catastrophic Stop Update
The NDR Catastrophic Sell Stop model combines time-tested, objective indicators designed to identify high risk periods for the equity market. The model (chart at right) deteriorated from last month but entered June with a fully invested equity allocation recommendation.

Figure 1: Smart Sector Catastrophic Stop Sell Model image.
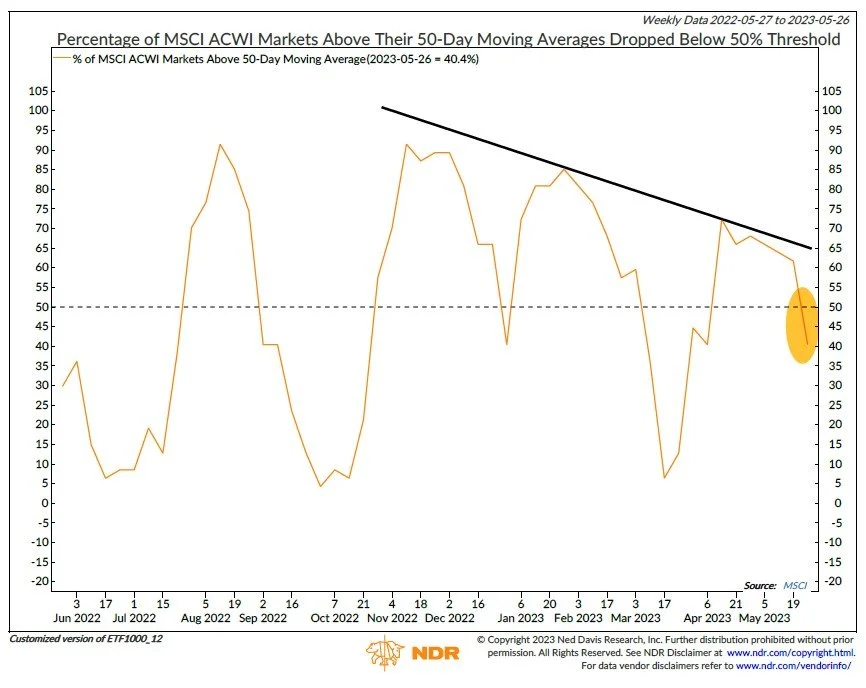
Figure 2: Percentage of MSCI ACWI Markets Above Their 50-Day Moving Averages Dropped Below 50% Threshold
The model deterioration was mostly driven by weaker breadth—global stock market breadth (chart at left) and breadth for High Yield and Emerging Market bonds both declined during the month. Additionally, stock volume supply continues to outpace demand, option-adjusted spreads remain wide, sentiment shows excessive optimism, and the Baltic Dry Index reflects weakening economic activity. Some of these indicators will need to improve if the stock market rally is going to continue deep into the second-half of the year.
Global Market Update
The ACWI ex. U.S. Total Return Index declined over 350 basis points in May. It was the index’s largest monthly drop since September. Among the strongest performing markets were Greece, Taiwan, Hungary, Turkey, and Japan, while the largest underperformers included Colombia, Hong Kong, Czech Republic, Belgium, and China.
Global economic growth continued to accelerate in April, according to the S&P Global Purchasing Managers’ Index (PMI) readings. The global composite (services and manufacturing) PMI climbed 0.8 points to 54.2, the highest level in 16 months and nearly a point above its long-term average. It was the fifth straight gain in the composite, the longest winning streak since October 2020. Historically, this many successive increases in the composite PMI almost always have been in the early stages of a global economic recovery.
The global services sector continued to power ahead strongly in April, as the PMI rose 1.0 point to 55.4, its fourth straight month of growth and the highest level since November 2021. Forward-looking indicators such new orders and the future output index also ticked up, suggesting continued upside in the global economy over the near-term.
Despite these constructive signs, the expansion may be short-lived. Growth remains uneven, as the strength in the PMI composite has almost entirely been driven by the services component. Manufacturing is declining among most economies. The share of PMIs in expansion territory slipped to just 34%, a four-month low and just shy of the one-third threshold historically associated with severe global recession. Moreover, fewer than half of the world’s economies reported either monthly or year-to-year gains in their PMIs. Furthermore, given the strength in services, inflation in the sector continues to run high, suggesting a central bank pivot to easing is less likely in the near-term.
Entering June, the non-U.S. equity Core model was neutral on our core holdings, including Japan, China, U.K., Canada, France, Germany, Switzerland, and Australia. The Explore model favors Mexico, Spain, New Zealand, South Korea, Italy, and Poland.
Figure 3: Breadth of Manufacturing Purchasing Managers’ Indexes (PMI)
Core Allocations
France’s allocation was reduced to neutral in June. The market generated a new all-time high toward the end of April, but it has pulled back due to some indicator deterioration. The percentage of stocks with rising trends weakened, internal measures softened, and ETF asset levels declined.
However, near-term trend measures still reside above their intermediate- and long-term counterparts. France’s services PMI remains in expansionary territory (chart at right). Earnings growth continues to be positive on a year-over-year basis and earnings

Figure 4: France Markit Services Purchasing Managers’ Index (PMI)

Figure 5: MSCI Switzerland 10-Year Real Annualized Price Returns Based On Price/Average 10-Year Earnings
Switzerland’s allocation continues to be near the benchmark weighting. The trend reflects improving one-year forward earnings estimates. Economy activity is improving as both industrial production and the Switzerland Manpower Employment Outlook Survey rise. Valuations remain attractive as the cyclically adjusted price-to-earnings ratio resides in favorable territory (chart at left).
Germany dropped to an neutral position for June. Multiple indicators turned bearish on the market. Weakening trend and breadth have been driven by declining ETF asset levels and falling economic sentiment. The Ifo index (chart at right), which measures sentiment among the businesses, fell in May for the first time in seven months and is dangerously close to levels associated with German recession.

Figure 6: Germany Industrial Production vs Ifo Business Climate Survey
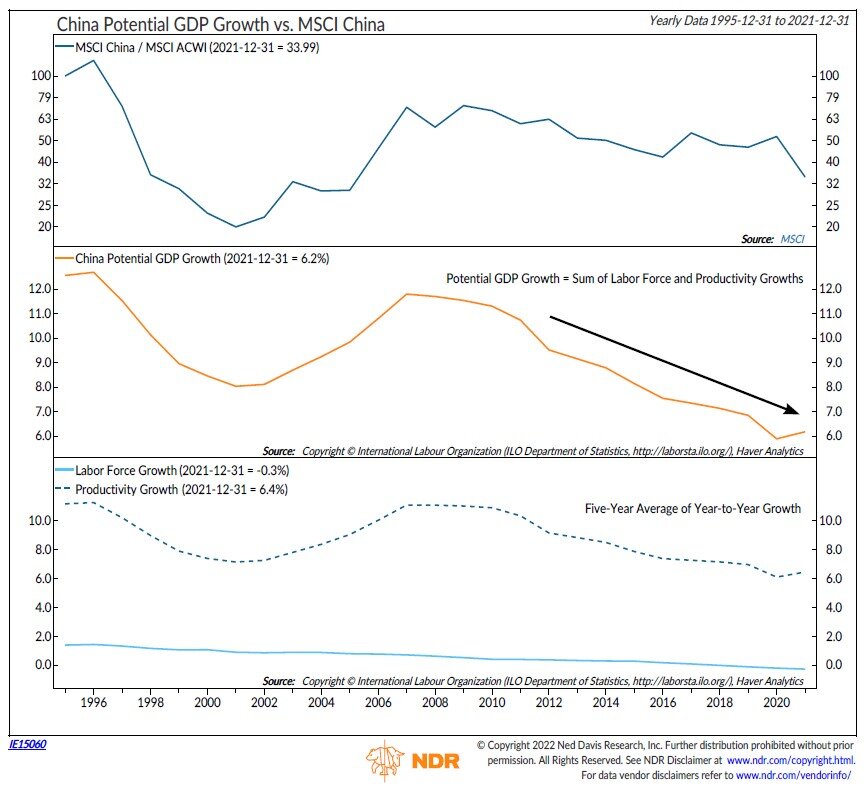
Figure 7: China Potential GDP Growth vs. MSCI China
China is also now a benchmark allocation as the economic recovery is losing steam. While the consumer continues to fuel growth, momentum is easing somewhat as pent-up demand is satisfied. Meanwhile the modest rebound in the industrial sector seems to have been short-lived. High frequency data has also softened, as evidenced by the Yicai high frequency economic activity index, which includes measures of traffic, housing activity, industrial activity, and even bankruptcies. The long-term trajectory for China is to the downside. Potential growth in China has been in a downtrend for over a decade due to a waning working age population and easing productivity growth (chart at left).
Explore Opportunities
Among the top ranked Explore markets are Mexico, Spain, New Zealand, South Korea, Italy, and Poland:
Italy, New Zealand, Mexico, Poland, and Spain have favorable price trends as their 50-day and 200-day moving averages continue to rise.
Over the last 5 days, Mexico is more than one standard deviation oversold, which historically has provided a near-term bounce opportunity.
Poland and Mexico have low market capitalization-to-GDP ratios, which typically indicates a favorable valuation.
Mexico’s manufacturing PMI is in the expansionary zone.
Spain and Italy possess two of the highest services PMI readings.
New Zealand is supported by double-digit one-year forward earnings growth estimates.
New Zealand and Mexico both have over 80% of stocks with positive earnings revisions from analysts.

Figure 8: Italy Markit Services Purchasing Mangers’ Index (PMI)
Summary
The Catastrophic Stop model has deteriorated, but it continues to recommend a fully invested allocation.
Entering June, the non-U.S. equity Core model was neutral on our core holdings, including Japan, China, U.K., Canada, France, Germany, Switzerland, and Australia. The Explore model favors Mexico, Spain, New Zealand, South Korea, Italy, and Poland.
The models combine macro, fundamental, technical, and sentiment indicators to determine opportunities and identify risks in an objective, weight-of-the-evidence approach.
NDR Strategists contributing to this publication: Brian Sanborn, CFA, Ed Clissold, CFA, Rob Anderson, CFA, Thanh Nguyen, CFA, Tim Hayes, CMT, Joe Kalish
For more information, please contact:
Day Hagan Asset Management
1000 S. Tamiami Trl
Sarasota, FL 34236
Toll-Free: (800) 594-7930
Office Phone: (941) 330-1702
Day Hagan/Ned Davis Research
Smart Sector® International ETF
Symbol: SSXU
Strategy Description
The Smart Sector® International strategy combines three Ned Davis Research quantitative investment strategies: The Core International, Explore International, and the NDR Catastrophic Stop
The Process Is Based On The Weight Of The Evidence
Core Allocation
The fund begins by overweighting and underweighting the largest non-U.S. equity markets based on Ned Davis Research’s proprietary models.
Each of the models utilizes market-specific, weight-of-the-evidence composites of fundamental, economic, technical, and behavioral indicators to determine each area’s probability of outperforming the ACWI ex. U.S. Markets are weighted accordingly relative to benchmark weightings.
Explore Allocation
To select smaller markets, the fund uses a multi-factor technical ranking system to choose the top markets. The markets with the highest rankings split the non-Core model allocation equally.
When Market Risks Become Extraordinarily High — Reduce Your Portfolio Risk
The model remains fully invested unless the Ned Davis Research Catastrophic Sell Stop (CSS) model is triggered, whereupon the equity-invested position is trimmed to 50%.
The NDR Catastrophic Sell Stop model combines time-tested, objective indicators designed to identify periods of high risk for the global equity market. The model uses price-based, breadth, deviation from trend, fundamental, economic, interest rate, behavioral, and volatility-based indicator composites.
When Market Risks Return To Normal — Put Your Money Back To Work
When the NDR CSS model moves back to bullish levels, indicating lower risk, the strategy immediately moves back to fully invested.
Ned Davis Research Disclaimers
The data and analysis contained within are provided "as is" and without warranty of any kind, either express or implied. The information is based on data believed to be reliable, but it is not guaranteed. NDR DISCLAIMS ANY AND ALL EXPRESS OR IMPLIED WARRANTIES, INCLUDING, BUT NOT LIMITED TO, ANY WARRANTIES OF MERCHANTABILITY, SUITABILITY OR FITNESS FOR A PARTICULAR PURPOSE OR USE. All performance measures do not reflect tax consequences, execution, commissions, and other trading costs, and as such investors should consult their tax advisors before making investment decisions, as well as realize that the past performance and results of the model are not a guarantee of future results. The Smart Sector® Strategy is not intended to be the primary basis for investment decisions and the usage of the model does not address the suitability of any particular in investment for any particular investor.
Using any graph, chart, formula, model, or other device to assist in deciding which securities to trade or when to trade them presents many difficulties and their effectiveness has significant limitations, including that prior patterns may not repeat themselves continuously or on any particular occasion. In addition, market participants using such devices can impact the market in a way that changes the effectiveness of such devices. NDR believes no individual graph, chart, formula, model, or other device should be used as the sole basis for any investment decision and suggests that all market participants consider differing viewpoints and use a weight of the evidence approach that fits their investment needs.
Disclosures
Past performance does not guarantee future results. No current or prospective client should assume future performance of any specific investment or strategy will be profitable or equal to past performance levels. All investment strategies have the potential for profit or loss. Changes in investment strategies, contributions or withdrawals and economic conditions may materially alter the performance of your portfolio. Different types of investments involve varying degrees of risk, and there can be no assurance that any specific investment or strategy will be suitable or profitable for a client’s portfolio. Historical performance results for investment indexes and/or categories generally do not reflect the deduction of transaction and/or custodial charges or the deduction of an investment management fee, the incurrence of which would have the effect of decreasing historical performance results. There can be no assurances that a portfolio will match or outperform any particular benchmark.
Day Hagan Asset Management is registered as an investment adviser with the United States Securities and Exchange Commission. SEC registration does not constitute an endorsement of the firm by the Commission nor does it indicate that the adviser has attained a particular level of skill or ability.
References to “NDR” throughout refer to Ned Davis Research, Inc. Clients engaging in this strategy will be advised by Day Hagan and will not have a contractual relationship with NDR. Day Hagan purchases signals from NDR, and Day Hagan is responsible for executing transactions on behalf of its clients and has discretion in how to implement the strategy.
NDR is a registered as an investment adviser with the Securities and Exchange Commission (SEC). NDR serves as the Signal Provider in connection with this strategy. The information provided here has not been approved or verified by the SEC or by any state or other authority. Additional information about NDR also is available on the SEC's website at https://www.adviserinfo.sec.gov/. This material is provided for informational purposes only and is not intended as an offer or solicitation with respect to the purchase or sale of any security or other financial instrument or to participate in any trading strategy. NDR’s strategies, including the model discussed in this publication, are intended to be used only by sophisticated investment professionals.
There may be a potential tax implication with a rebalancing strategy. Re-balancing involves selling some positions and buying others, and this activity results in realized gains and losses for the positions that are sold. The performance calculations do not reflect the impact that paying taxes would have, and for taxable accounts, any taxable gains would reduce the performance on an after-tax basis. This reduction could be material to the overall performance of an actual trading account. NDR does not provide legal, tax or accounting advice. Please consult your tax advisor in connection with this material, before implementing such a strategy, and prior to any withdrawals that you make from your portfolio.
There is no guarantee that any investment strategy will achieve its objectives, generate dividends or avoid losses.
© 2023 Ned Davis Research, Inc. | © 2023 Day Hagan Asset Management, LLC
© Copyright Ned Davis Research, Inc. All Rights Reserved | These materials are historical and intended to be used only as examples, and do not necessarily reflect current views or advice of NDR or its representatives.
