
Day Hagan/Ned Davis Research Smart Sector® International Strategy Update January 2023
A downloadable PDF copy of the Article:
Day Hagan/Ned Davis Research Smart Sector® International Strategy Update January 2023 (pdf)
Catastrophic Stop Update
The NDR Catastrophic Sell Stop model combines time-tested, objective indicators designed to identify high risk periods for the equity market. The model (Figure 1) deteriorated in December but remains with a fully invested equity allocation recommendation.
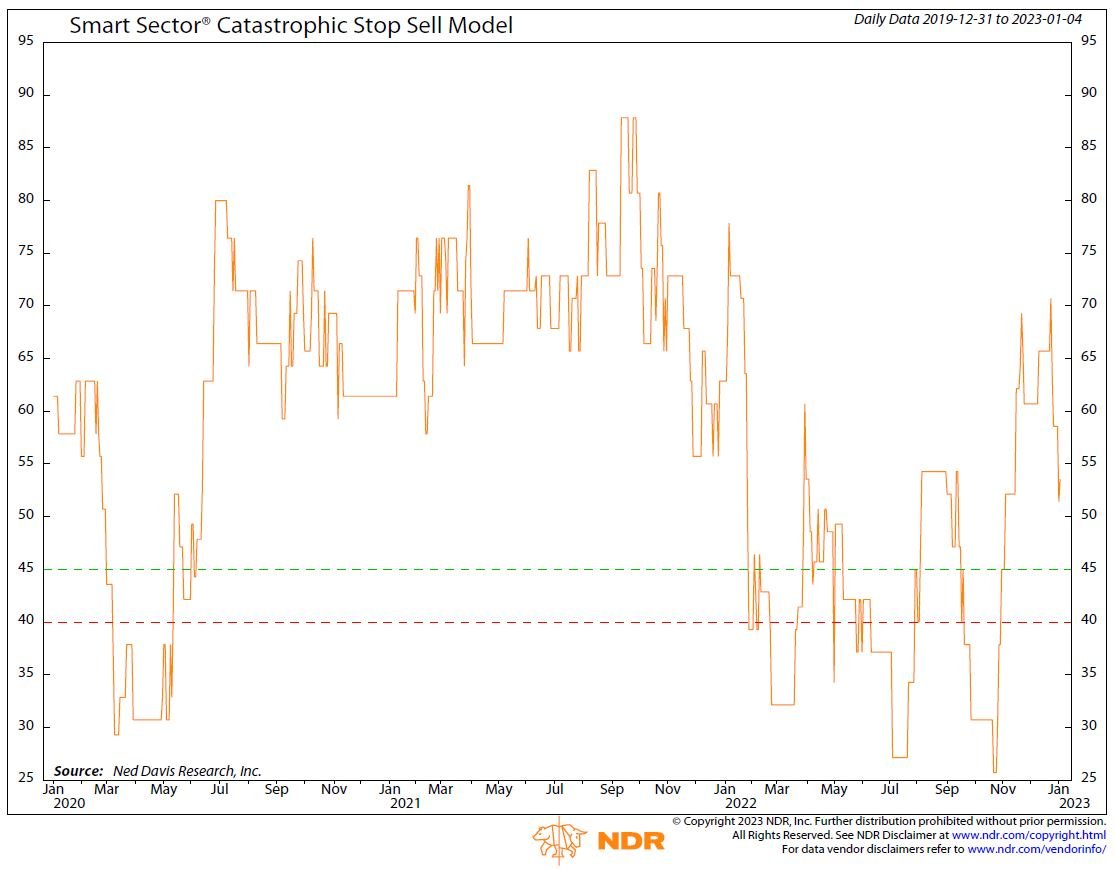
Figure 1: Smart Sector Catastrophic Stop Sell Model image.

Figure 2: Pessimistic Short-Term Sentiment: Favors Equity Exposure
Weaker price-based measures were to blame, moving the internal composite reading to its lowest level since October 2022. The stock/bond relative strength ratio rolled over and only 40% of global equity markets traded above their intermediate-term trends. In terms of external influences, high yield and Emerging Market bond breadth weakened, which was partly offset by short-term pessimistic stock market sentiment (Figure 2).
If the near-term market weakness continues, additional technical indicators should roll over and trigger another bearish signal. Conversely, if volume demand outpaces supply and global shipping rates improve, then it could indicate a new rally might transpire in early 2023.
Global Market Update
After rising during October and November, the ACWI ex. U.S. Total Return Index declined by more than 70 basis points in December. Among the strongest performing markets were Hong Kong, Turkey, Colombia, and Poland, while the largest underperformers included Qatar, Peru, Mexico, and the United Arab Emirates.
The global economy contracted for a fourth-straight month in November, according to the S&P Global Purchasing Managers’ Index (PMI). The global composite (services and manufacturing) PMI reflects the deepest contraction since June 2020. At its current level, the composite PMI is historically consistent with a 0.9% decrease in global annual real Gross Domestic Product (GDP) growth.
Most of the downside risks that plagued the global economy in 2022 will likely continue in 2023, but from a much lower starting point. Global savings have been depleted, while labor markets are starting to show signs of slowing. Moreover, given the lagged impact of monetary policy on the economy (Figure 3), the indicators, many of which are already on the cusp of levels associated with global recession, are likely to worsen in the coming months.
However, one major positive is that price pressures continue to deteriorate. Both the global composite input and outprice indexes fell to their lowest since February 2021. Even so, the indexes (especially input prices) remain well above their pre-COVID levels.
Entering December, the non-U.S. equity Core model overweighted China, France, and Switzerland, while underweighting Japan, Germany, the U.K., and Canada. The Explore model favored Spain, Italy, Mexico, Peru, and New Zealand.
Figure 3: Global PMI vs. Central Bank Breadth
Core Allocations
Switzerland remains above benchmark allocation this month. It had the largest one-month increase across the Citigroup Economic Surprise indices as the economy’s reading rebounded from a ten-year low (Figure 4). Switzerland had the third highest manufacturing PMI, which also increased last month. Relative valuations continue to favor equities and the cyclically adjusted price-to-earnings ratio is in its second-cheapest quintile. The technical indicators improved to reflect this opportunity as trend, momentum, and breadth measures produced positive readings on the market.

Figure 4: Citigroup Economic Surprise Index for the Swiss Franc

Figure 5: France Earnings Growth
France’s allocation continues to be above benchmark weighting. Although its manufacturing PMI resides in contractionary territory, France’s reading has risen over the last month and quarter. It is just below the key threshold of 50. Earnings growth remains positive on a year-over-year basis (Figure 5). The trend has improved as the market trades above its 50- and 200-day moving averages.
China’s allocation improved to above benchmark weighting. China’s market surged following the easing of its zero-COVID policy. Among the 47 ACWI components, the China index has been the strongest performer, up over 30% since October. However, China’s economy presents the greatest uncertainty to the global outlook in 2023. Given the abrupt and premature nature of the economic reopening, large swaths of the population could choose to disengage from the economy given the rising risk of infection and death. Also, other elements of the economy, such as external demand and real estate remain fragile. Valuations may already reflect the risk as China’s cyclically adjusted price-to-earnings ratio is one standard deviation below its historical tendency (Figure 6).

Figure 6: MSCI China

Figure 7: Japan Inflation Swaps Trending Lower Indicating a Softening Economy
Japan fell to significantly below benchmark allocation. Weak trend, breadth, and momentum indicators reflect challenged near-term earnings growth, unattractive valuations, sentiment reversing from optimistic conditions, and economic activity softening, as evidenced by falling inflation swaps (Figure 7) .
Canada was one of the worst-performing developed markets in December as it declined almost 5%. The market plummeted to underweight status due to a weakening trend, expensive valuations, and deteriorating economic data. The country’s market capitalization-to-GDP ratio is among the highest across global markets. The economy’s manufacturing PMI resides in contractionary territory, and it declined last month (Figure 8).

Figure 8: Canada Markit Manufacturing PMI
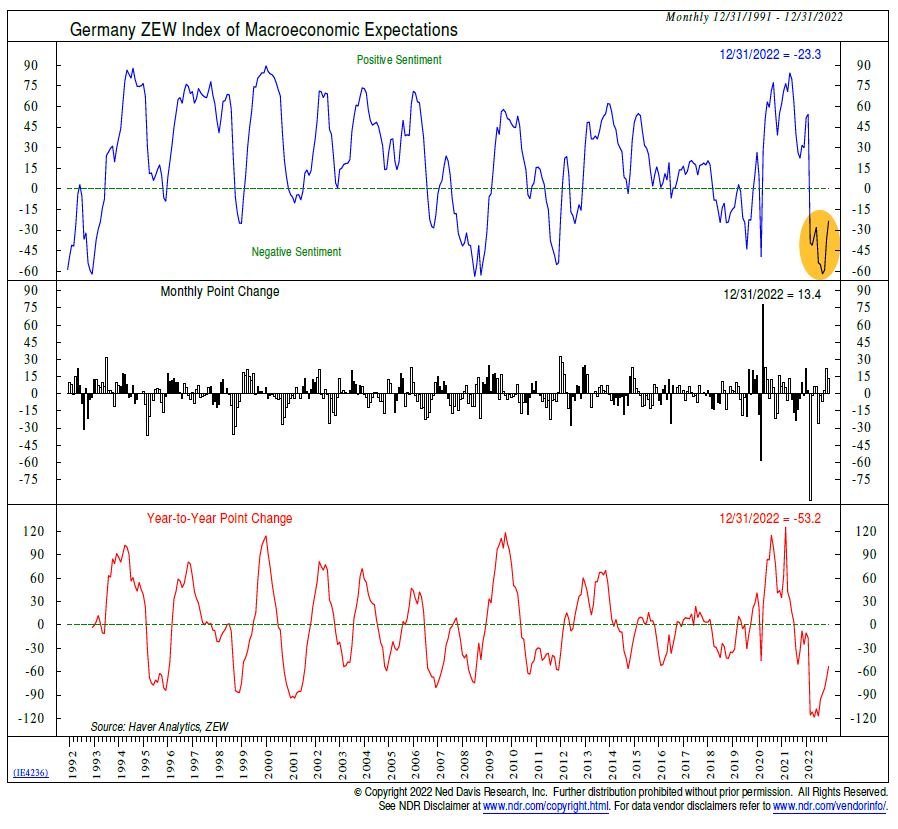
Figure 9: Germany ZEW Index of Macroeconomic Expectations
Germany’s allocation rose, but the market is still below benchmark allocation. The relative trend has fallen due to weak economic activity, low consumer confidence, and negative economic sentiment (Figure 9).
Explore Opportunities
The top-ranked smaller markets are Peru, Mexico, Spain, Italy, and New Zealand.
Peru, Mexico, New Zealand, Italy, and Spain have favorable near-term trends as their 50-day moving averages trade above their 200-day moving averages.
Over the last ten days, Mexico is more than one standard deviation oversold, which historically has provided a near-term bounce opportunity.
Peru, Mexico, New Zealand, Italy, and Spain have low market capitalization-to-GDP ratios, which typically indicates a favorable valuation opportunity.
New Zealand currently has the highest Citigroup Economic Surprise Index reading (Figure 10) and largest percentage of positive earnings revisions across global markets.
Mexico is one of the few economies with Composite Leading Indicator and PMI readings in expansionary territory.
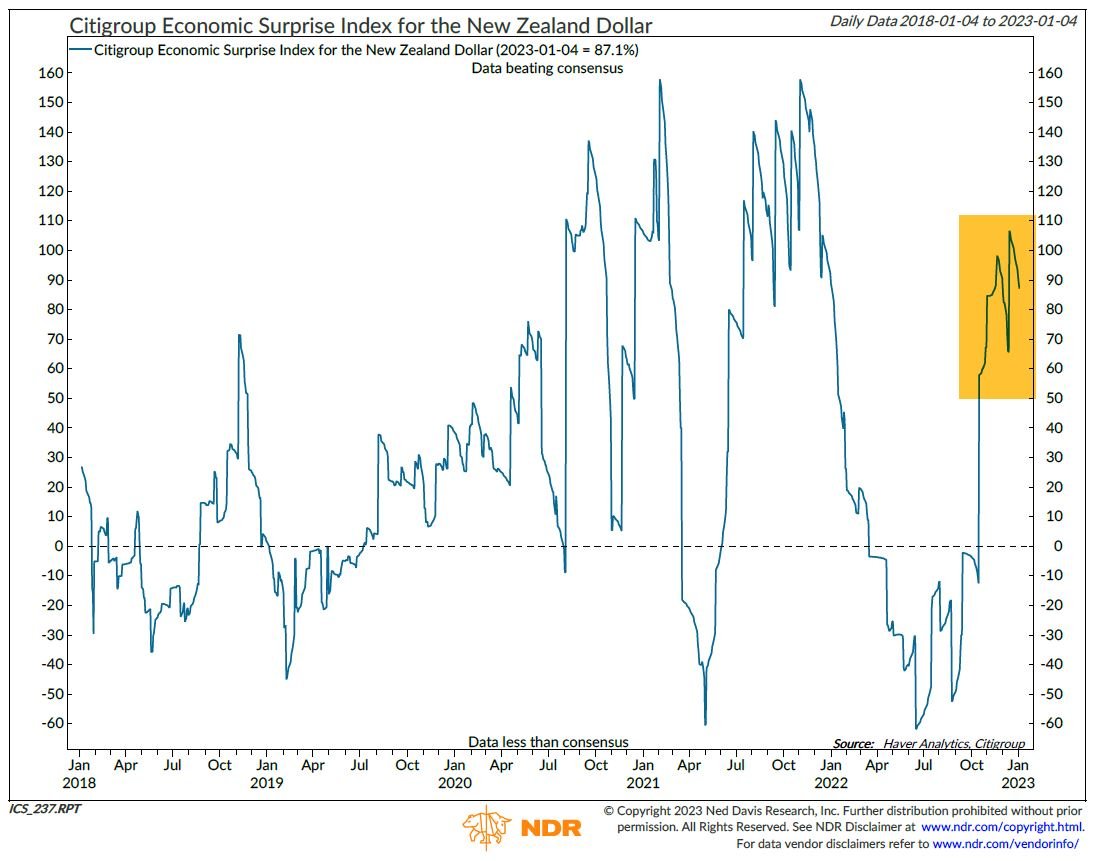
Figure 10: Citigroup Economic Surprise Index for the New Zealand Dollar
Summary
At the start of January, the Catastrophic Stop model recommended a fully invested position according to the Core and Explore international allocation models. The Core model overweighted France, Switzerland, and China while underweighting Germany, Canada, the U.K., and Japan. The Explore model favored Peru, Mexico, Spain, Italy, and New Zealand. The international models combine macro, fundamental, technical, and sentiment indicators to determine opportunities and identify risks in an objective, weight-of-the-evidence approach.
NDR Strategists contributing to this publication: Brian Sanborn, CFA, Ed Clissold, CFA, Rob Anderson, CFA, Thanh Nguyen, CFA, Tim Hayes, CMT, Joe Kalish
For more information, please contact:
Day Hagan Asset Management
1000 S. Tamiami Trl
Sarasota, FL 34236
Toll-Free: (800) 594-7930
Office Phone: (941) 330-1702
Day Hagan/Ned Davis Research
Smart Sector® International ETF
Symbol: SSXU
Strategy Description
The Smart Sector® International strategy combines three Ned Davis Research quantitative investment strategies: The Core International, Explore International, and the NDR Catastrophic Stop
The Process Is Based On The Weight Of The Evidence
Core Allocation
The fund begins by overweighting and underweighting the largest non-U.S. equity markets based on Ned Davis Research’s proprietary models.
Each of the models utilizes market-specific, weight-of-the-evidence composites of fundamental, economic, technical, and behavioral indicators to determine each area’s probability of outperforming the ACWI ex. U.S. Markets are weighted accordingly relative to benchmark weightings.
Explore Allocation
To select smaller markets, the fund uses a multi-factor technical ranking system to choose the top markets. The markets with the highest rankings split the non-Core model allocation equally.
When Market Risks Become Extraordinarily High — Reduce Your Portfolio Risk
The model remains fully invested unless the Ned Davis Research Catastrophic Sell Stop (CSS) model is triggered, whereupon the equity-invested position is trimmed to 50%.
The NDR Catastrophic Sell Stop model combines time-tested, objective indicators designed to identify periods of high risk for the global equity market. The model uses price-based, breadth, deviation from trend, fundamental, economic, interest rate, behavioral, and volatility-based indicator composites.
When Market Risks Return To Normal — Put Your Money Back To Work
When the NDR CSS model moves back to bullish levels, indicating lower risk, the strategy immediately moves back to fully invested.
Ned Davis Research Disclaimers
The data and analysis contained within are provided "as is" and without warranty of any kind, either express or implied. The information is based on data believed to be reliable, but it is not guaranteed. NDR DISCLAIMS ANY AND ALL EXPRESS OR IMPLIED WARRANTIES, INCLUDING, BUT NOT LIMITED TO, ANY WARRANTIES OF MERCHANTABILITY, SUITABILITY OR FITNESS FOR A PARTICULAR PURPOSE OR USE. All performance measures do not reflect tax consequences, execution, commissions, and other trading costs, and as such investors should consult their tax advisors before making investment decisions, as well as realize that the past performance and results of the model are not a guarantee of future results. The Smart Sector® Strategy is not intended to be the primary basis for investment decisions and the usage of the model does not address the suitability of any particular in investment for any particular investor.
Using any graph, chart, formula, model, or other device to assist in deciding which securities to trade or when to trade them presents many difficulties and their effectiveness has significant limitations, including that prior patterns may not repeat themselves continuously or on any particular occasion. In addition, market participants using such devices can impact the market in a way that changes the effectiveness of such devices. NDR believes no individual graph, chart, formula, model, or other device should be used as the sole basis for any investment decision and suggests that all market participants consider differing viewpoints and use a weight of the evidence approach that fits their investment needs.
Disclosures
Past performance does not guarantee future results. No current or prospective client should assume future performance of any specific investment or strategy will be profitable or equal to past performance levels. All investment strategies have the potential for profit or loss. Changes in investment strategies, contributions or withdrawals and economic conditions may materially alter the performance of your portfolio. Different types of investments involve varying degrees of risk, and there can be no assurance that any specific investment or strategy will be suitable or profitable for a client’s portfolio. Historical performance results for investment indexes and/or categories generally do not reflect the deduction of transaction and/or custodial charges or the deduction of an investment management fee, the incurrence of which would have the effect of decreasing historical performance results. There can be no assurances that a portfolio will match or outperform any particular benchmark.
Day Hagan Asset Management is registered as an investment adviser with the United States Securities and Exchange Commission. SEC registration does not constitute an endorsement of the firm by the Commission nor does it indicate that the adviser has attained a particular level of skill or ability.
References to “NDR” throughout refer to Ned Davis Research, Inc. Clients engaging in this strategy will be advised by Day Hagan and will not have a contractual relationship with NDR. Day Hagan purchases signals from NDR, and Day Hagan is responsible for executing transactions on behalf of its clients and has discretion in how to implement the strategy.
NDR is a registered as an investment adviser with the Securities and Exchange Commission (SEC). NDR serves as the Signal Provider in connection with this strategy. The information provided here has not been approved or verified by the SEC or by any state or other authority. Additional information about NDR also is available on the SEC's website at https://www.adviserinfo.sec.gov/. This material is provided for informational purposes only and is not intended as an offer or solicitation with respect to the purchase or sale of any security or other financial instrument or to participate in any trading strategy. NDR’s strategies, including the model discussed in this publication, are intended to be used only by sophisticated investment professionals.
There may be a potential tax implication with a rebalancing strategy. Re-balancing involves selling some positions and buying others, and this activity results in realized gains and losses for the positions that are sold. The performance calculations do not reflect the impact that paying taxes would have, and for taxable accounts, any taxable gains would reduce the performance on an after-tax basis. This reduction could be material to the overall performance of an actual trading account. NDR does not provide legal, tax or accounting advice. Please consult your tax advisor in connection with this material, before implementing such a strategy, and prior to any withdrawals that you make from your portfolio.
There is no guarantee that any investment strategy will achieve its objectives, generate dividends or avoid losses.
© 2023 Ned Davis Research, Inc. | © 2023 Day Hagan Asset Management, LLC
© Copyright Ned Davis Research, Inc. All Rights Reserved | These materials are historical and intended to be used only as examples, and do not necessarily reflect current views or advice of NDR or its representatives.
