
Day Hagan/Ned Davis Research Smart Sector® International Strategy Update April 2023
A downloadable PDF copy of the Article:
Day Hagan/Ned Davis Research Smart Sector® International Strategy Update April 2023 (pdf)
Catastrophic Stop Update
The NDR Catastrophic Sell Stop model combines time-tested, objective indicators designed to identify high risk periods for the equity market. The model (chart right) deteriorated in March but remains with a fully invested equity allocation recommendation entering April.

Figure 1: Smart Sector Catastrophic Stop Sell Model image.

Figure 2: Weakening Short-Term is Unfavorable for Equity Exposure
The model deterioration was mostly driven by weaker technicals—stock/bond relative strength, global stock market breadth, and stock market short-term trend (chart at left) all declined to bearish levels during the month. In terms of external influences, improvement in the Baltic Dry Index and breadth for High Yield and Emerging Market bonds was offset by widening high-yield option-adjusted spreads.
If stock volume demand outpaces supply, and trend and relative strength improve, then it could indicate the market rally could be sustained. Conversely, if the stock market weakens in the near-term and investors return to fears of a recession, the stock market rally could be short-lived.
Global Market Update
The ACWI ex. U.S. Total Return Index increased over 250 basis points in March. The index has oscillated between positive and negative monthly returns since November. Among the strongest performing markets were Saudi Arabia, Denmark, China, Peru, and Portugal, while the largest underperformers included Austria, Greece, United Arab Emirates, Turkey, and Chile.
The global economy continued to show signs of improvement, according to the February S&P Global Purchasing Managers’ Index (PMI) readings. The global composite PMI jumped 2.3 points, its third straight increase and the most since July 2020, to 52.1, the highest level and first expansion since mid-2022.
Global new orders expanded for the first time in seven months, while the future output index climbed to its highest level in nearly a year. China contributed greatly to the global figure as the end of its zero-COVID policy has seen growth surge. Even outside of China, the expansion broadened across the globe, as the global composite PMI excluding China also rose to an eight-month high.
Despite these favorable signs, downside risks remain elevated. History suggests that tight monetary policy will continue to limit potential upside in the global economy for the foreseeable future (chart at bottom). Moreover, stubbornly high inflation may keep central banks tighter for longer, effectively increasing the risk of recession.
Entering April, the non-U.S. equity Core model overweighted the U.K., Germany, and Switzerland while underweighting Canada and China. The Explore model favored the Philippines, Thailand, Netherlands, New Zealand, Spain, and Mexico.
Figure 3: Global PMI vs. Central Bank Breadth
Core Allocations
France’s allocation has retreated from an overweight to a benchmark weighting as the market has rallied back to near its all-time high. The trend is positive as the market trades above its 50- and 200-day moving averages, and breadth has strongly improved, but it is overbought at current levels (chart at right). The strengthening technical indicators reflect macroeconomic and fundamental improvement. France’s services PMI remains in expansionary territory. Earnings growth continues to be positive on a year-over-year basis.

Figure 4: MSCI France Price & A/D Line Relative to 100-Day Moving Average
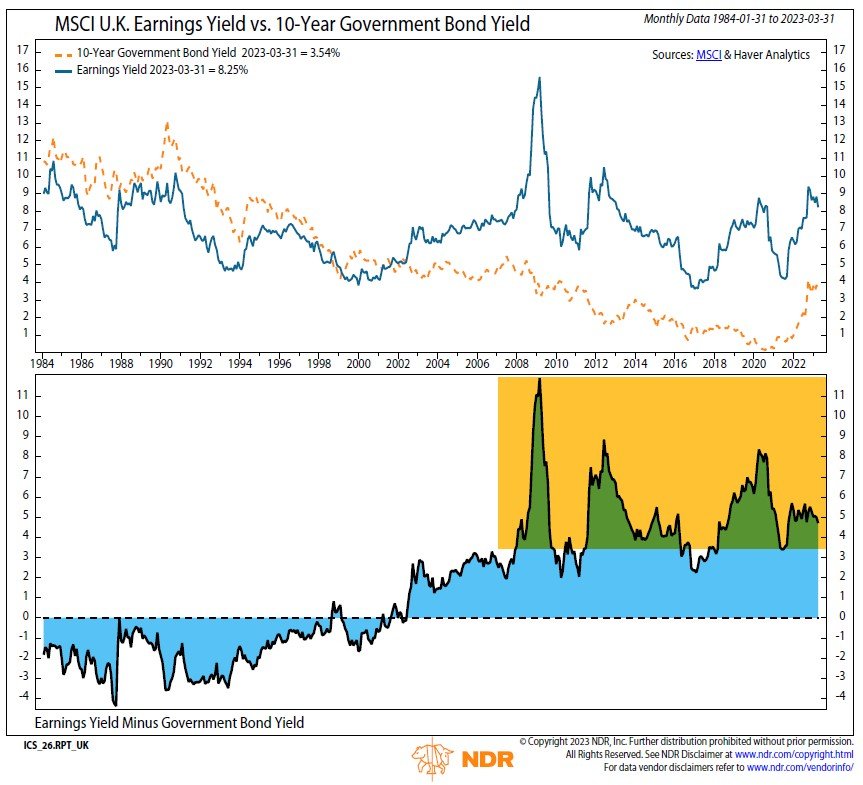
Figure 5: MSCI U.K. Earnings Yield vs 10-Year Government Bond Yield
The U.K shifted to overweight status this month. The market is within 5% of its all-time high. Market sentiment is reversing from a pessimistic condition. Option-adjusted spreads widened during March, but their overall trend remains lower. The long-term, cyclically adjusted price-to-earnings ratio continues to trade below its 40-year average. Relative valuations are also attractive for the U.K., as its earnings yield is over 400 bps above its 10-year yield (chart at left).
China has improved to a benchmark allocation. Although the Chinese economy expanded at a fast pace in February, the government’s growth target of around 5% points to more subdued stimulus this year, which will limit the industrial rebound. The market’s relative strength, absolute price trend, and momentum all reflect expected headwinds. Emerging Market high-yield credit-spreads have widened over the last two months (chart at right), showing concerns in the fixed-income market.
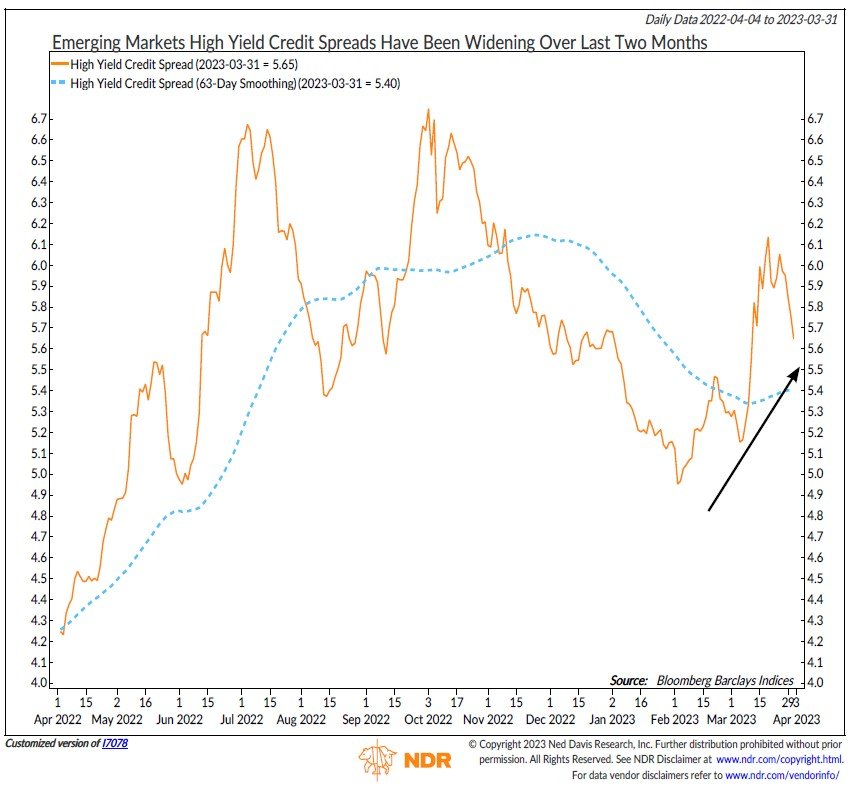
Figure 6: Emerging Markets High Yield Credit Spreads Have Been Widening Over Last Two Months
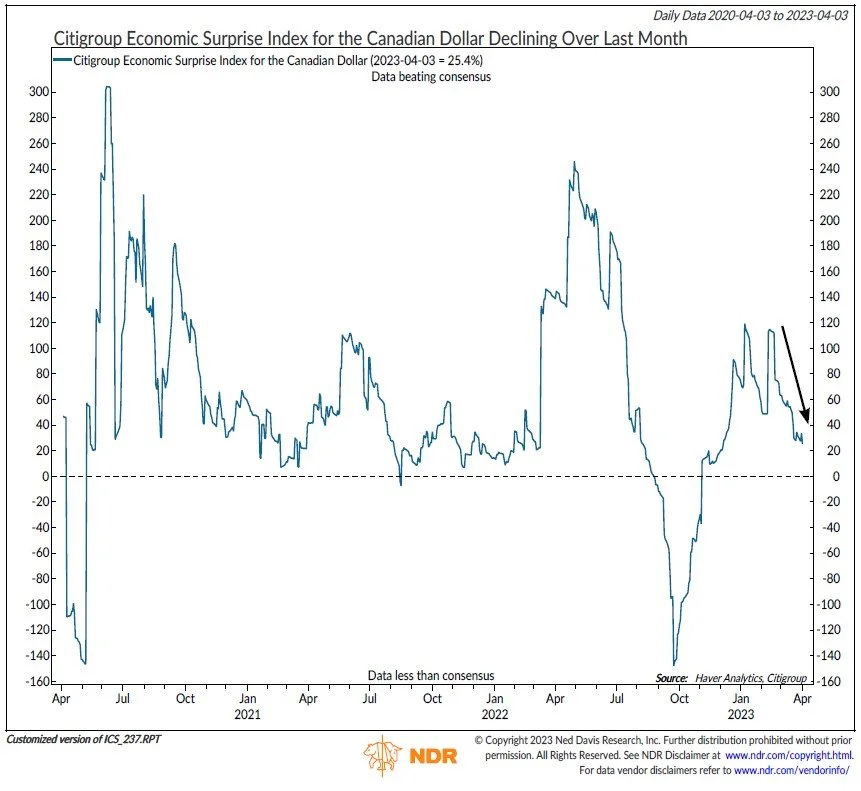
Figure 7: Citigroup Economic Surprise Index for the Canadian Dollar Declining Over Last Month
Canada has the largest underweight position for April. Economic expectations have significantly softened over the last month. Canada had one of the largest declines in the Citigroup Economic Surprise Index during March (chart at left). Only one indicator currently has a positive outlook for Canada. However, it is a longer-term price trend indicator that has been deteriorating. None of the external measures (valuation, currency, macroeconomic) currently have a favorable view on the market.
Explore Opportunities
Among the top-ranked Explore markets are the Philippines, Thailand, Netherlands, New Zealand, Spain, and Mexico:
Philippines, Thailand, Netherlands, New Zealand, and Spain have favorable price trends as their 50-day moving averages trade above their 200-day moving averages.
Over the last five days, the Philippines and New Zealand regions are more than one standard deviation oversold, which historically has provided a near-term bounce opportunity.
Philippines and New Zealand have low market capitalization-to-GDP ratios, which typically indicate a favorable valuation.
Philippines possesses cyclically adjusted price-to-earnings ratios (long-term valuation metrics), trading almost one standard deviation below the historical median.
Philippines and New Zealand have elevated manufacturing PMIs, which are in the expansionary zone.
Philippines, Singapore, Netherlands, and New Zealand have double-digit one-year forward earnings growth estimates.
As shown in the chart below, China (and Emerging Markets in general) remain at historically inexpensive levels.

Figure 8: MSCI China
Summary
The Catastrophic Stop model deteriorated in March but remains with a fully invested Core and Explore allocation entering April. The Core model overweighted the U.K., Germany, and Switzerland while underweighting Canada and China. The Explore model favored the Philippines, Thailand, Netherlands, New Zealand, Spain, and Mexico. The models combine macro, fundamental, technical, and sentiment indicators to determine opportunities and identify risks in an objective, weight-of-the-evidence approach.
NDR Strategists contributing to this publication: Brian Sanborn, CFA, Ed Clissold, CFA, Rob Anderson, CFA, Thanh Nguyen, CFA, Tim Hayes, CMT, Joe Kalish
For more information, please contact:
Day Hagan Asset Management
1000 S. Tamiami Trl
Sarasota, FL 34236
Toll-Free: (800) 594-7930
Office Phone: (941) 330-1702
Day Hagan/Ned Davis Research
Smart Sector® International ETF
Symbol: SSXU
Strategy Description
The Smart Sector® International strategy combines three Ned Davis Research quantitative investment strategies: The Core International, Explore International, and the NDR Catastrophic Stop
The Process Is Based On The Weight Of The Evidence
Core Allocation
The fund begins by overweighting and underweighting the largest non-U.S. equity markets based on Ned Davis Research’s proprietary models.
Each of the models utilizes market-specific, weight-of-the-evidence composites of fundamental, economic, technical, and behavioral indicators to determine each area’s probability of outperforming the ACWI ex. U.S. Markets are weighted accordingly relative to benchmark weightings.
Explore Allocation
To select smaller markets, the fund uses a multi-factor technical ranking system to choose the top markets. The markets with the highest rankings split the non-Core model allocation equally.
When Market Risks Become Extraordinarily High — Reduce Your Portfolio Risk
The model remains fully invested unless the Ned Davis Research Catastrophic Sell Stop (CSS) model is triggered, whereupon the equity-invested position is trimmed to 50%.
The NDR Catastrophic Sell Stop model combines time-tested, objective indicators designed to identify periods of high risk for the global equity market. The model uses price-based, breadth, deviation from trend, fundamental, economic, interest rate, behavioral, and volatility-based indicator composites.
When Market Risks Return To Normal — Put Your Money Back To Work
When the NDR CSS model moves back to bullish levels, indicating lower risk, the strategy immediately moves back to fully invested.
Ned Davis Research Disclaimers
The data and analysis contained within are provided "as is" and without warranty of any kind, either express or implied. The information is based on data believed to be reliable, but it is not guaranteed. NDR DISCLAIMS ANY AND ALL EXPRESS OR IMPLIED WARRANTIES, INCLUDING, BUT NOT LIMITED TO, ANY WARRANTIES OF MERCHANTABILITY, SUITABILITY OR FITNESS FOR A PARTICULAR PURPOSE OR USE. All performance measures do not reflect tax consequences, execution, commissions, and other trading costs, and as such investors should consult their tax advisors before making investment decisions, as well as realize that the past performance and results of the model are not a guarantee of future results. The Smart Sector® Strategy is not intended to be the primary basis for investment decisions and the usage of the model does not address the suitability of any particular in investment for any particular investor.
Using any graph, chart, formula, model, or other device to assist in deciding which securities to trade or when to trade them presents many difficulties and their effectiveness has significant limitations, including that prior patterns may not repeat themselves continuously or on any particular occasion. In addition, market participants using such devices can impact the market in a way that changes the effectiveness of such devices. NDR believes no individual graph, chart, formula, model, or other device should be used as the sole basis for any investment decision and suggests that all market participants consider differing viewpoints and use a weight of the evidence approach that fits their investment needs.
Disclosures
Past performance does not guarantee future results. No current or prospective client should assume future performance of any specific investment or strategy will be profitable or equal to past performance levels. All investment strategies have the potential for profit or loss. Changes in investment strategies, contributions or withdrawals and economic conditions may materially alter the performance of your portfolio. Different types of investments involve varying degrees of risk, and there can be no assurance that any specific investment or strategy will be suitable or profitable for a client’s portfolio. Historical performance results for investment indexes and/or categories generally do not reflect the deduction of transaction and/or custodial charges or the deduction of an investment management fee, the incurrence of which would have the effect of decreasing historical performance results. There can be no assurances that a portfolio will match or outperform any particular benchmark.
Day Hagan Asset Management is registered as an investment adviser with the United States Securities and Exchange Commission. SEC registration does not constitute an endorsement of the firm by the Commission nor does it indicate that the adviser has attained a particular level of skill or ability.
References to “NDR” throughout refer to Ned Davis Research, Inc. Clients engaging in this strategy will be advised by Day Hagan and will not have a contractual relationship with NDR. Day Hagan purchases signals from NDR, and Day Hagan is responsible for executing transactions on behalf of its clients and has discretion in how to implement the strategy.
NDR is a registered as an investment adviser with the Securities and Exchange Commission (SEC). NDR serves as the Signal Provider in connection with this strategy. The information provided here has not been approved or verified by the SEC or by any state or other authority. Additional information about NDR also is available on the SEC's website at https://www.adviserinfo.sec.gov/. This material is provided for informational purposes only and is not intended as an offer or solicitation with respect to the purchase or sale of any security or other financial instrument or to participate in any trading strategy. NDR’s strategies, including the model discussed in this publication, are intended to be used only by sophisticated investment professionals.
There may be a potential tax implication with a rebalancing strategy. Re-balancing involves selling some positions and buying others, and this activity results in realized gains and losses for the positions that are sold. The performance calculations do not reflect the impact that paying taxes would have, and for taxable accounts, any taxable gains would reduce the performance on an after-tax basis. This reduction could be material to the overall performance of an actual trading account. NDR does not provide legal, tax or accounting advice. Please consult your tax advisor in connection with this material, before implementing such a strategy, and prior to any withdrawals that you make from your portfolio.
There is no guarantee that any investment strategy will achieve its objectives, generate dividends or avoid losses.
© 2023 Ned Davis Research, Inc. | © 2023 Day Hagan Asset Management, LLC
© Copyright Ned Davis Research, Inc. All Rights Reserved | These materials are historical and intended to be used only as examples, and do not necessarily reflect current views or advice of NDR or its representatives.
