
Day Hagan/Ned Davis Research Smart Sector® Fixed Income Strategy Update January 2023
A downloadable PDF copy of the Article:
Day Hagan/Ned Davis Research Smart Sector® Fixed Income Strategy Update January 2023 (pdf)
Risk Management Update
The risk management model (Figure 1) seeks to reduce exposure to fixed income sectors most sensitive to equity drawdowns. While the risk management model deteriorated from last month, it entered January recommending full model exposure to areas most sensitive to equity markets: U.S. High Yield, Emerging Markets, U.S. Investment Grade, and Floating Rate Notes.

Figure 1: Smart Sector® Fixed Income Risk Management Model
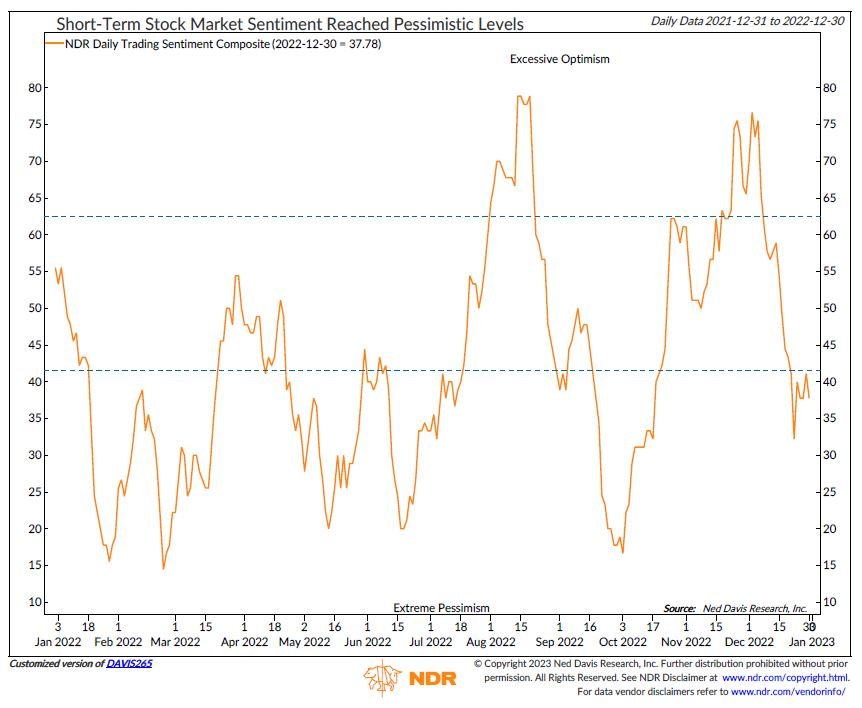
Figure 2: Short-Term Stock Market Sentiment Reached Pessimistic Levels
Weaker stock market price-based measures were to blame for the deterioration, moving the internal composite reading to its lowest level since October 2022. The stock/bond relative strength ratio rolled over and only 40% of global equity markets traded above their intermediate-term trends. In terms of external influences, high yield and Emerging Market bond breadth weakened, which was partly offset by short-term pessimistic stock market sentiment (Figure 2).
For now, the weight-of-the-evidence recommends a fully invested allocation to fixed income sectors according to the model.
Fixed Income Market Update
2022 was a challenging year for fixed income investors. The Bloomberg Barclays U.S. Aggregate Bond Total Return Index’s return was slightly negative in December and finished the year down about 13%. The index was down nine out of 12 months in 2022.
Throughout the month of December, the world’s most prominent central banks doubled down on and/or adopted a more hawkish stance. The Fed remained committed to fighting inflation as the dot plot for the terminal rate moved up 50 basis points (bp) from September. The European Central Bank stressed the need for more aggressive rate hikes at its December meeting. Meanwhile, the Bank of Japan surprised investors by increasing the cap on its 10-year yield target.
The global central bank rate increased at record speed in 2022 and is now at its highest level since 2008 (Figure 3). Based on this metric, one could assume that central banks have sufficiently tightened policy. But on a real basis, interest rates are still resoundingly negative, indicating that global central bank policy still isn’t tight enough. Although inflation pressures should ease in 2023, inflation is likely to stay higher for longer.
Despite the Fed’s most aggressive tightening cycle since 1980, the real fed funds rate remains negative. A total of 75 bp of hikes in 2023 could see the real rate finally rise into restrictive territory. Unsure of when the Fed may pause, U.S. Treasuries sold off in December, resulting in a backup of yields, which had implications for fixed income sector leadership.
Entering January, the fixed income allocation strategy is overweight U.S. Long-Term Treasurys, U.S. High Yield, Mortgage-Backed Securities, and Emerging Market Bonds, while being underweight Floating Rate Notes, U.S. Investment Grade Corporate, Treasury Inflation-Protected Securities, and International Investment Grade bonds.
Figure 3: Global Central Bank Interest Rate (Daily)
The model’s allocation to U.S. Long-Term Treasurys saw a sharp rise in January, which pushed it to a significant overweight. The weak equity market trend and lower inflation expectations remained bullish for the sector. There was enough technical improvement in December to push one trend indicator to bullish (Figure 4) and another one to neutral.

Figure 4: U.S. Long Term Treasury Technical Cross Bullish for the Sector

Figure 5: Lower 10-Year Yield is Bullish for U.S. Mortgage Backed Securities
Mortgage-Backed Securities’ allocation improved to overweight in January. While technical indicators aren’t fully confirming yet, high-yield spreads have narrowed—suggesting greater investor risk appetite—and are bullish for the sector. Additionally, the 10-year yield (which mortgage rates are correlated to) has likely peaked and is now bullish for the sector (Figure 5).
Emerging Market (EM) bonds dropped in allocation in January but remain overweight. The U.S. dollar continued to roll over from its peak levels. Due to the inverse relationship with Emerging Markets, a weaker dollar is a bullish condition for both emerging market equities and bonds. EM bond technicals are mixed. While relative strength continues to be bullish, the short-term trend in absolute returns turned bearish (Figure 6).

Figure 6: Emerging Market Bonds Short-Term Trend in Absolute Returns is Bearish

Figure 7: U.S. High Yield Bonds Short-Term Absolute Return Trend is Bearish
U.S. High Yield also dropped in allocation this month but remains overweight. Most technical indicators remain positive as relative strength, high yield upside participation breadth, and volatility are bullish. However, the short-term trend in absolute returns moved bearish (FIgure 7), joining the bearish small-cap equity trend.
Floating Rate Notes’ allocation jumped sharply in January, but it remains at a slight underweight allocation. Floating rate notes typically outperform during a rising rate environment and yields backed up again in December. Trend, price momentum, and spreads remain bearish for the sector. However, relative strength versus other fixed income sectors improved in December and is now bullish (Fight 8).
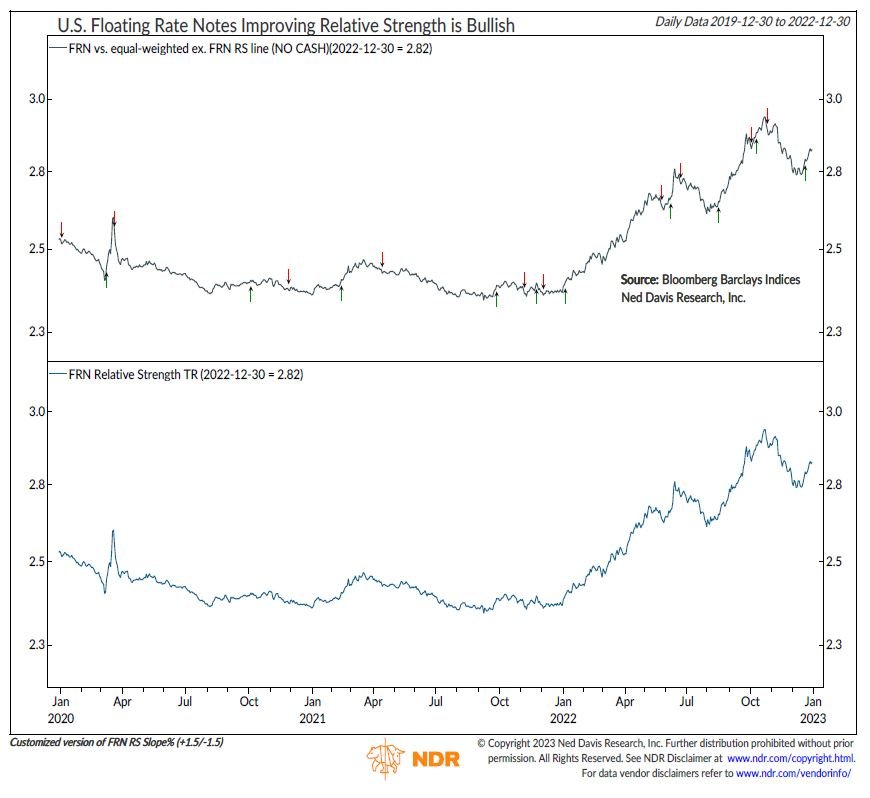
Figure 8: U.S. Floating Rate Notes Improving Relative Strength is Bullish

Figure 9: Widening Option-Adjusted Spreads is Bearish for U.S. Investment Grade Corporate Bonds
Allocation to the U.S. Investment Grade sector fell sharply, moving the sector from an overweight to an underweight position this month. Only two indicators are bullish—credit default swaps and a technical indicator. Bond volatility, the U.S. dollar, and mean reversion remain bearish for the sector. In December, option-adjusted spreads—another measurement of default risk—widened, which is bearish for the sector (Figure 9).
Summary
Credit sectors such as high yield and investment grade are now seeing mixed performance. A declining U.S. dollar has led to emerging market bond outperformance and international investment grade underperformance. Lower inflation expectations have made U.S. TIPS less attractive, particularly compared with nominal U.S. Treasurys. U.S. Long-Term Treasurys have seen enough technical improvement to move to an overweight allocation. The likelihood of a recession in 2023 would be an added tailwind to Treasurys.
NDR Strategists contributing to this publication: Brian Sanborn, CFA, Ed Clissold, CFA, Rob Anderson, CFA, Thanh Nguyen, CFA, Tim Hayes, CMT, Joe Kalish
For more information, please contact:
Day Hagan Asset Management
1000 S. Tamiami Trl
Sarasota, FL 34236
Toll Free: (800) 594-7930
Office Phone: (941) 330-1702
Day Hagan/Ned Davis Research
Smart Sector® Fixed Income ETF
Symbol: SSFI
Strategy Description
The Smart Sector® Fixed Income strategy combines two Ned Davis Research quantitative investment strategies: The NDR Fixed Income Allocation and the NDR Catastrophic Stop.
The Process Is Based On The Weight Of The Evidence
The fund begins by overweighting and underweighting fixed-income sectors based on Ned Davis Research’s proprietary fixed-income models.
Each of the models utilizes sector-specific, weight-of-the-evidence composites of fundamental, economic, technical, and behavioral indicators to determine each area's probability of outperforming the other categories.
Sectors are weighted accordingly relative to an equal-weighted benchmark.
When Market Risks Become Extraordinarily High - Reduce Your Portfolio Risk
The model remains fully invested unless the Ned Davis Research Catastrophic Sell Stop (CSS) model is triggered, whereupon the areas which underperform during periods of market stress (high yield, Emerging Markets, U.S. Investment Grade, and Floating Rate Notes) are trimmed by 50%..
The NDR Catastrophic Sell Stop model combines time-tested, objective indicators designed to identify periods of high risk for the broad financial markets. The model uses price-based, breadth, deviation from trend, fundamental, economic, interest rate, behavioral and volatility-based indicator composites.
When Market Risks Return To Normal — Put Your Money Back To Work
When the NDR CSS model moves back to bullish levels, indicating lower risk, the strategy immediately moves back to fully invested.
Ned Davis Research Disclaimers
The data and analysis contained within are provided "as is" and without warranty of any kind, either express or implied. The information is based on data believed to be reliable, but it is not guaranteed. NDR DISCLAIMS ANY AND ALL EXPRESS OR IMPLIED WARRANTIES, INCLUDING, BUT NOT LIMITED TO, ANY WARRANTIES OF MERCHANTABILITY, SUITABILITY OR FITNESS FOR A PARTICULAR PURPOSE OR USE. All performance measures do not reflect tax consequences, execution, commissions, and other trading costs, and as such investors should consult their tax advisors before making investment decisions, as well as realize that the past performance and results of the model are not a guarantee of future results. The Smart Sector® Strategy is not intended to be the primary basis for investment decisions and the usage of the model does not address the suitability of any particular in Fixed Income vestment for any particular investor.
Using any graph, chart, formula, model, or other device to assist in deciding which securities to trade or when to trade them presents many difficulties and their effectiveness has significant limitations, including that prior patterns may not repeat themselves continuously or on any particular occasion. In addition, market participants using such devices can impact the market in a way that changes the effectiveness of such devices. NDR believes no individual graph, chart, formula, model, or other device should be used as the sole basis for any investment decision and suggests that all market participants consider differing viewpoints and use a weight of the evidence approach that fits their investment needs.
Disclosures
Past performance does not guarantee future results. No current or prospective client should assume future performance of any specific investment or strategy will be profitable or equal to past performance levels. All investment strategies have the potential for profit or loss. Changes in investment strategies, contributions or withdrawals and economic conditions may materially alter the performance of your portfolio. Different types of investments involve varying degrees of risk, and there can be no assurance that any specific investment or strategy will be suitable or profitable for a client’s portfolio. Historical performance results for investment indexes and/or categories generally do not reflect the deduction of transaction and/or custodial charges or the deduction of an investment management fee, the incurrence of which would have the effect of decreasing historical performance results. There can be no assurances that a portfolio will match or outperform any particular benchmark.
Day Hagan Asset Management is registered as an investment adviser with the United States Securities and Exchange Commission. SEC registration does not constitute an endorsement of the firm by the Commission nor does it indicate that the adviser has attained a particular level of skill or ability. Day Hagan Asset Management claims compliance with the Global Investment Performance Standards (GIPS®). GIPS is a registered trademark of CFA Institute. CFA Institute does not endorse or promote this organization, nor does it warrant the accuracy or quality of the content contained herein. Day Hagan Asset Management has been independently verified for the periods June 30, 2008 through December 31, 2020. The U.S. dollar is the currency used to express performance. Calculation Methodology: Pure gross of fees returns are calculated gross of management and custodial fees. Net of fees returns are calculated by reducing the gross number by an average investment management fee of .85% and gross of custodian (trust) fees. Net of fees returns for wrap accounts are calculated net of management fees, transaction costs and all administrative fees charged directly to the client by the broker-dealer. To receive a GIPS composite report, contact Linda Brown at (941) 330-1702 or email at linda.brown@dayhagan.com.
References to “NDR” throughout refer to Ned Davis Research, Inc. Clients engaging in this strategy will be advised by Day Hagan and will not have a contractual relationship with NDR. Day Hagan purchases signals from NDR, and Day Hagan is responsible for executing transactions on behalf of its clients and has discretion in how to implement the strategy.
NDR is a registered as an investment adviser with the Securities and Exchange Commission (SEC). NDR serves as the Signal Provider in connection with this strategy. The information provided here has not been approved or verified by the SEC or by any state or other authority. Additional information about NDR also is available on the SEC's website at https://www.adviserinfo.sec.gov/. This material is provided for informational purposes only and is not intended as an offer or solicitation with respect to the purchase or sale of any security or other financial instrument or to participate in any trading strategy. NDR’s strategies, including the model discussed in this publication, are intended to be used only by sophisticated investment professionals.
There may be a potential tax implication with a rebalancing strategy. Re-balancing involves selling some positions and buying others, and this activity results in realized gains and losses for the positions that are sold. The performance calculations do not reflect the impact that paying taxes would have, and for taxable accounts, any taxable gains would reduce the performance on an after-tax basis. This reduction could be material to the overall performance of an actual trading account. NDR does not provide legal, tax or accounting advice. Please consult your tax advisor in connection with this material, before implementing such a strategy, and prior to any withdrawals that you make from your portfolio.
There is no guarantee that any investment strategy will achieve its objectives, generate dividends or avoid losses.
© 2023 Ned Davis Research, Inc. | © 2023 Day Hagan Asset Management, LLC
© Copyright Ned Davis Research, Inc. All Rights Reserved | These materials are historical and intended to be used only as examples, and do not necessarily reflect current views or advice of NDR or its representatives.
